Fig. 5
Download original image
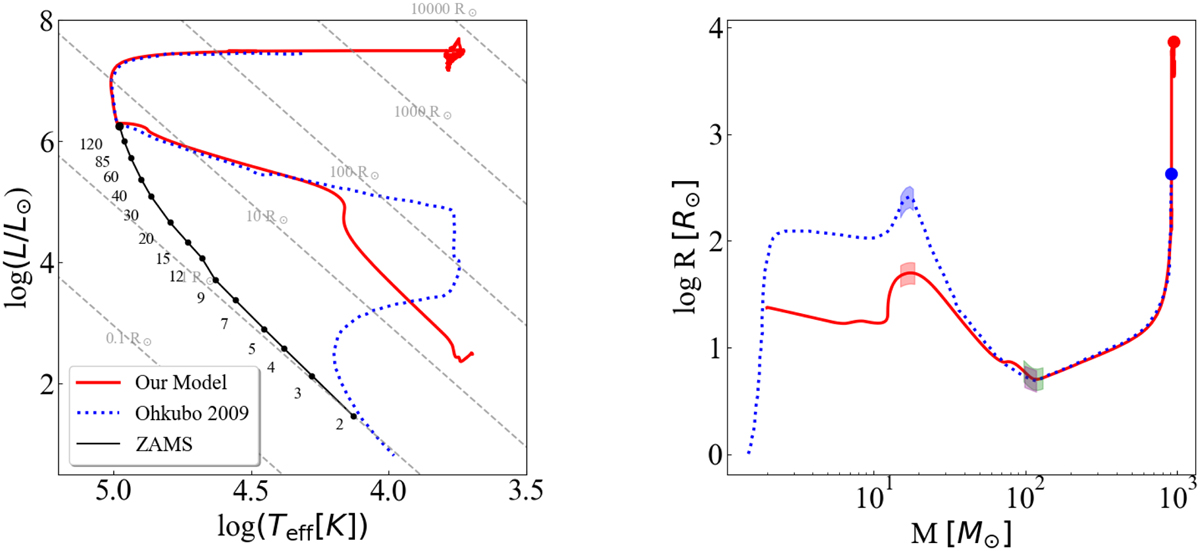
Evolution of accreting Pop III models following the accretion law of Yoshida et al. (2007) depicted in the HR diagram. The dotted blue line corresponds to the Y-1 model in Fig. 5 of Ohkubo et al. (2009), and the solid red line represents the model computed in this work using GENEC. The black line represents the ZAMS line, and the dots indicate the masses in M⊙. The dotted grey lines are the iso-radii, with values depicted in solar radii. Right panel: evolution of the radius versus mass of models shown in the left panel. Due to different initial conditions, the two models possess different radii during the pre-main sequence (first shaded region) and reach core hydrogen burning at a near-identical mass of around 120 M⊙ (second shaded region). A stark difference arises at the core Si burning, as modelled by Ohkubo et al. (2009), which finishes the evolution in blue at a radius of log(R) ≈ 2.5 (blue dot), whereas our model reaches the Hayashi limit with log(R) ≈ 4 (red dot).
Current usage metrics show cumulative count of Article Views (full-text article views including HTML views, PDF and ePub downloads, according to the available data) and Abstracts Views on Vision4Press platform.
Data correspond to usage on the plateform after 2015. The current usage metrics is available 48-96 hours after online publication and is updated daily on week days.
Initial download of the metrics may take a while.