Fig. 2
Download original image
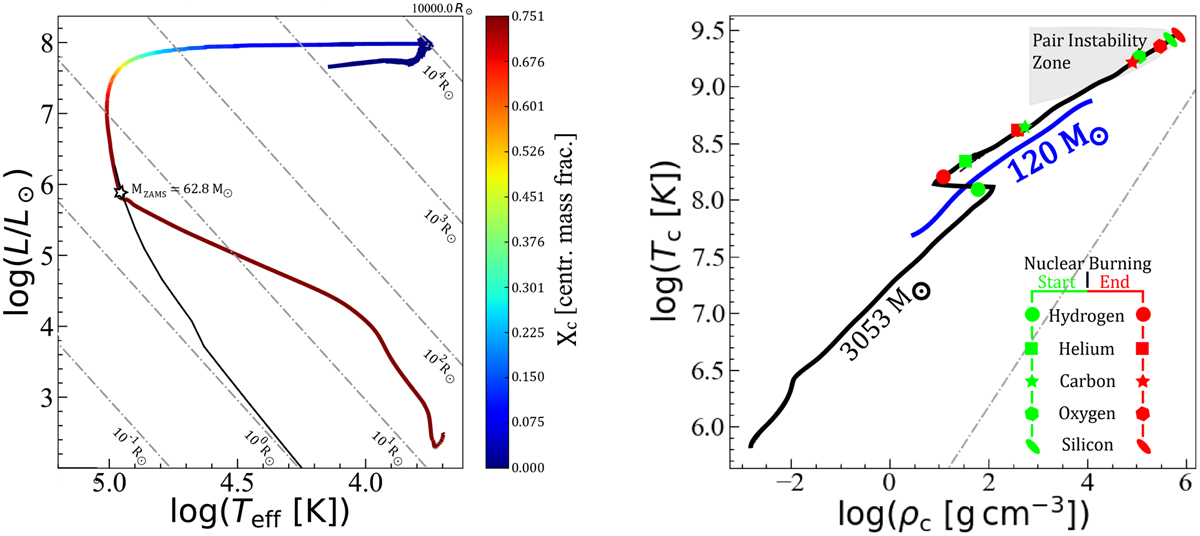
Evolution of a 3000 M⊙ model at a constant accretion rate. Left panel: HR diagram depicting the evolution of a model until the end of core silicon burning with a constant accretion rate of 10−3 M⊙ yr−1. The black line represents the ZAMS line for Z = 0 metallicity. The star symbol on the track represents the start of core hydrogen burning when the mass of the model is 62.8 M⊙. Right panel: evolution of the central temperature versus the central density of the model. The blue line marks a 120 M⊙ model at Z = 0 metallicity, starting from ZAMS and ending at core helium burning.
Current usage metrics show cumulative count of Article Views (full-text article views including HTML views, PDF and ePub downloads, according to the available data) and Abstracts Views on Vision4Press platform.
Data correspond to usage on the plateform after 2015. The current usage metrics is available 48-96 hours after online publication and is updated daily on week days.
Initial download of the metrics may take a while.