Fig. 1
Download original image
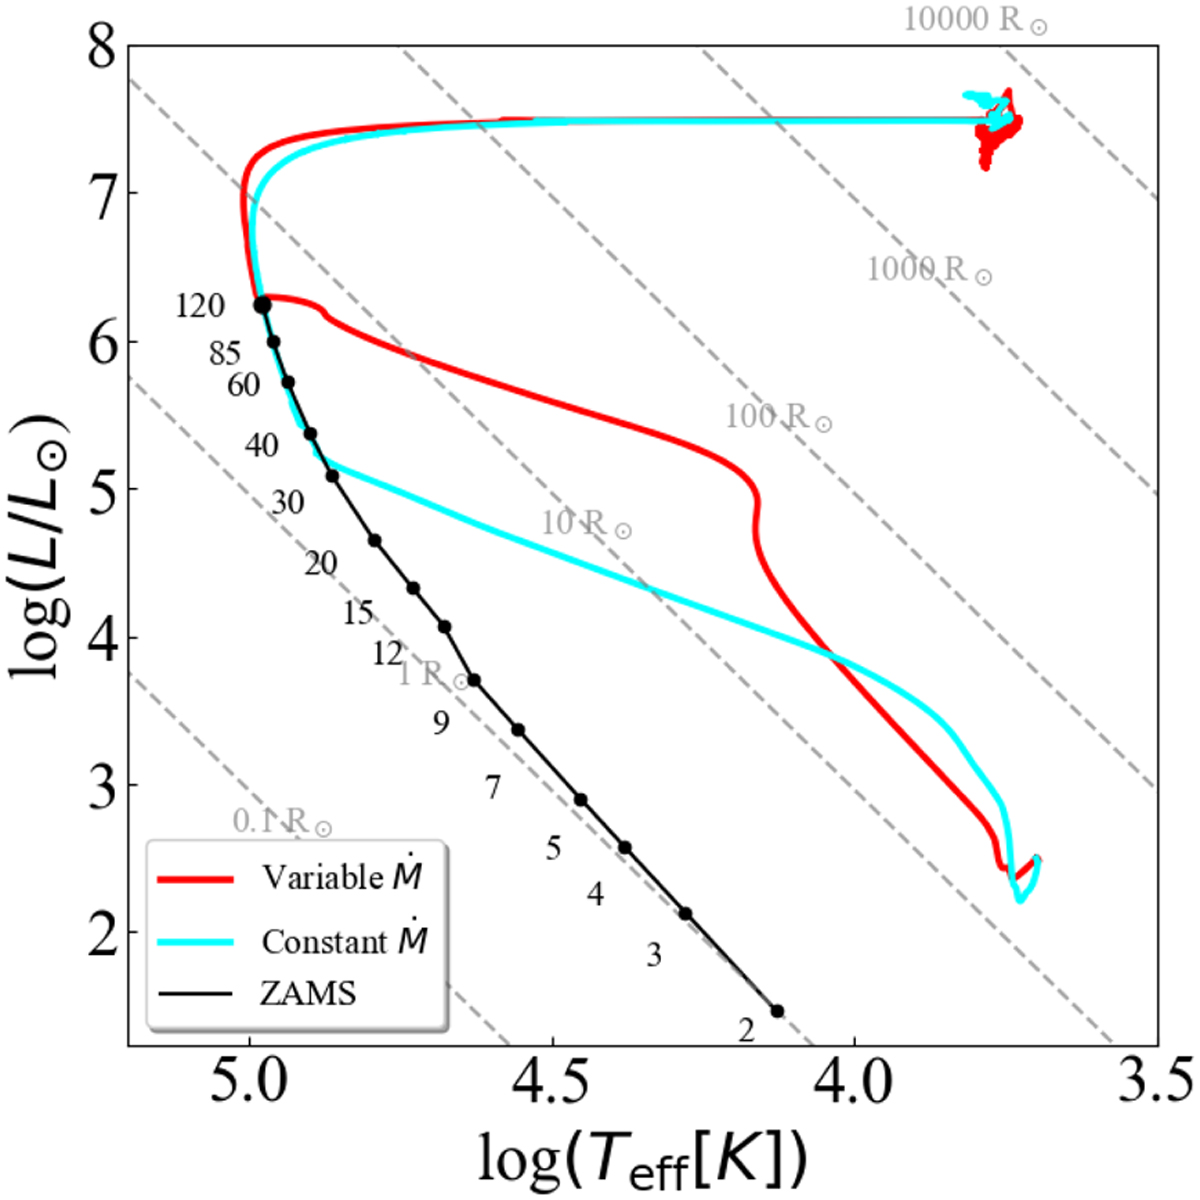
HR diagrams of two models with identical masses of 917 M⊙, accreted until the end of core silicon burning. The red line depicts the model computed using the variable accretion rate from Yoshida et al. (2007), and the cyan line represents a model with a constant accretion rate of 2.615 × 10⁻⁴M⊙ yr−1. The black line is the ZAMS line, and the dots indicate the masses in M⊙. The dotted grey lines are the iso-radius line, with values depicted in solar radii.
Current usage metrics show cumulative count of Article Views (full-text article views including HTML views, PDF and ePub downloads, according to the available data) and Abstracts Views on Vision4Press platform.
Data correspond to usage on the plateform after 2015. The current usage metrics is available 48-96 hours after online publication and is updated daily on week days.
Initial download of the metrics may take a while.