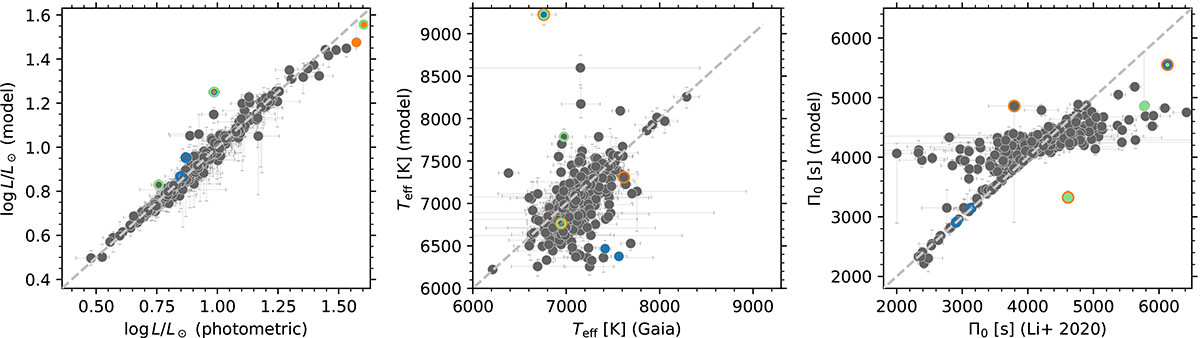
Fig. 3.
Download original image
Correlations between observed properties (input values) and the recovered values (model). From left to right, we show log L/L⊙, Teff, and Π0. Notably, outliers in one panel are not necessarily outliers in other panels. To show this property, we highlight the three most outlying points (the difference divided by the measurement uncertainty) in each panel with colour and indicate the same stars with coloured outlines in the other two panels. Outliers in luminosity are shown in orange, outliers in effective temperature in blue, and outliers in Π0 in green. The shift towards intermediate Π0 is discussed in the main text.
Current usage metrics show cumulative count of Article Views (full-text article views including HTML views, PDF and ePub downloads, according to the available data) and Abstracts Views on Vision4Press platform.
Data correspond to usage on the plateform after 2015. The current usage metrics is available 48-96 hours after online publication and is updated daily on week days.
Initial download of the metrics may take a while.