Open Access
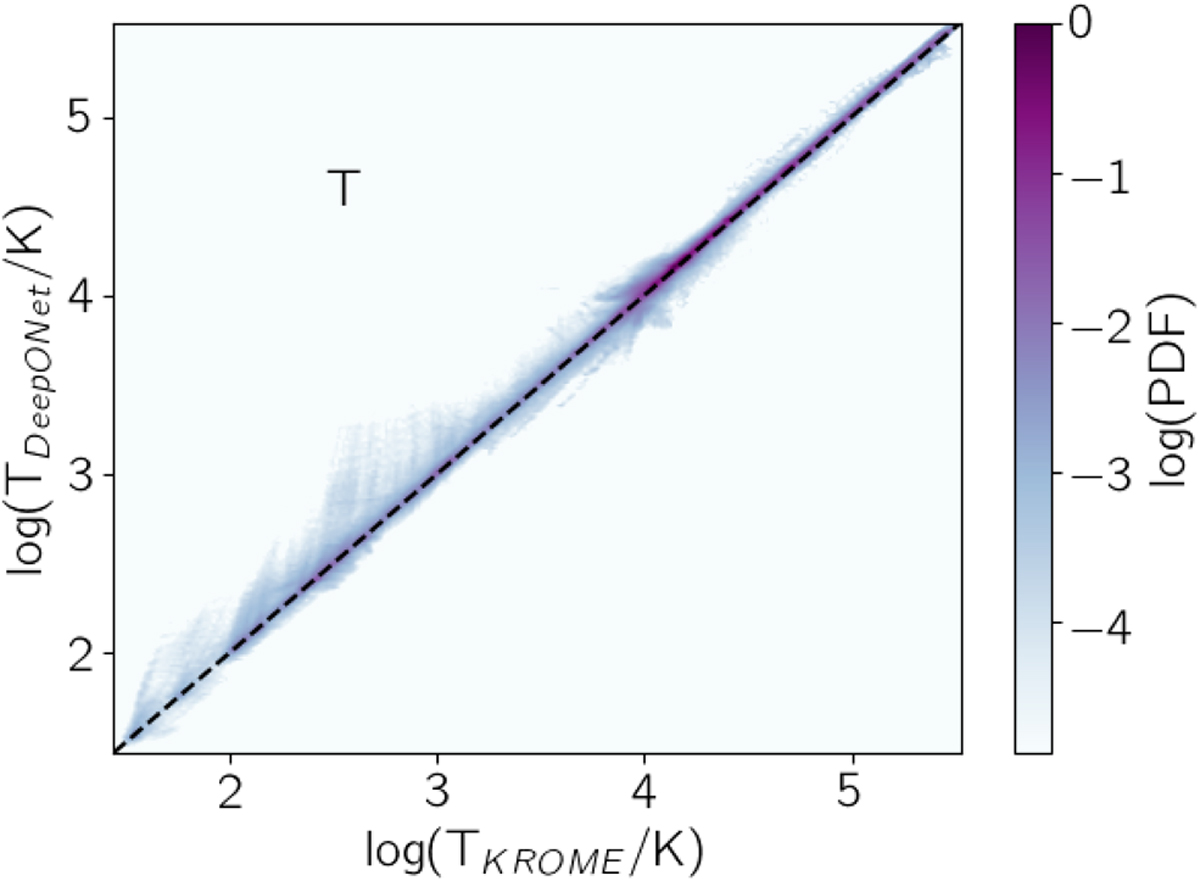
Fig. A.1
Download original image
Predicted vs true data shown as 2D PDF for the temperature with respect to KROME data. The black dashed line is the bisector and represent a region without dicrepancy between data and predictions.
Current usage metrics show cumulative count of Article Views (full-text article views including HTML views, PDF and ePub downloads, according to the available data) and Abstracts Views on Vision4Press platform.
Data correspond to usage on the plateform after 2015. The current usage metrics is available 48-96 hours after online publication and is updated daily on week days.
Initial download of the metrics may take a while.