Fig. 4
Download original image
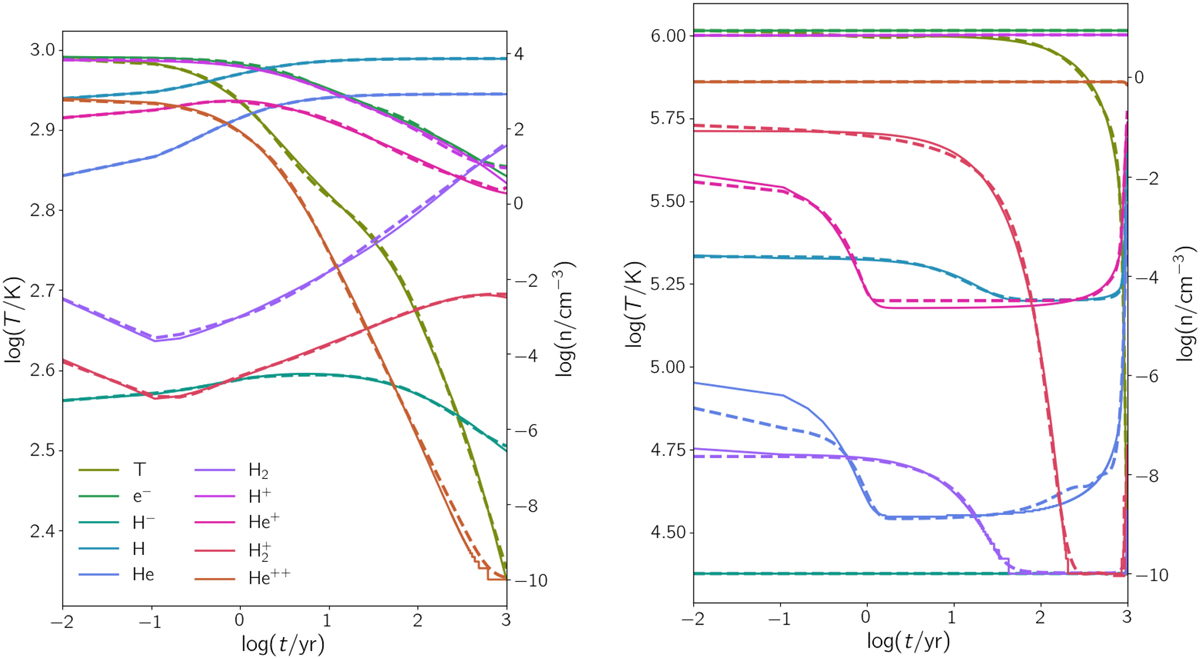
Examples of the time (t) evolution of temperature (T) and the density (n, see the legend) of all the species in the chemical network. The solid lines represent the solutions computed using KROME, while the dashed lines depict the predictions of our models, with each line being a single solution from the emulator. In the left (right) panel the gas number density is n = 104 cm−3 (initial temperature is T = 106 K), namely, outside the range of the training dataset (see Table 2).
Current usage metrics show cumulative count of Article Views (full-text article views including HTML views, PDF and ePub downloads, according to the available data) and Abstracts Views on Vision4Press platform.
Data correspond to usage on the plateform after 2015. The current usage metrics is available 48-96 hours after online publication and is updated daily on week days.
Initial download of the metrics may take a while.