Open Access
Fig. 3
Download original image
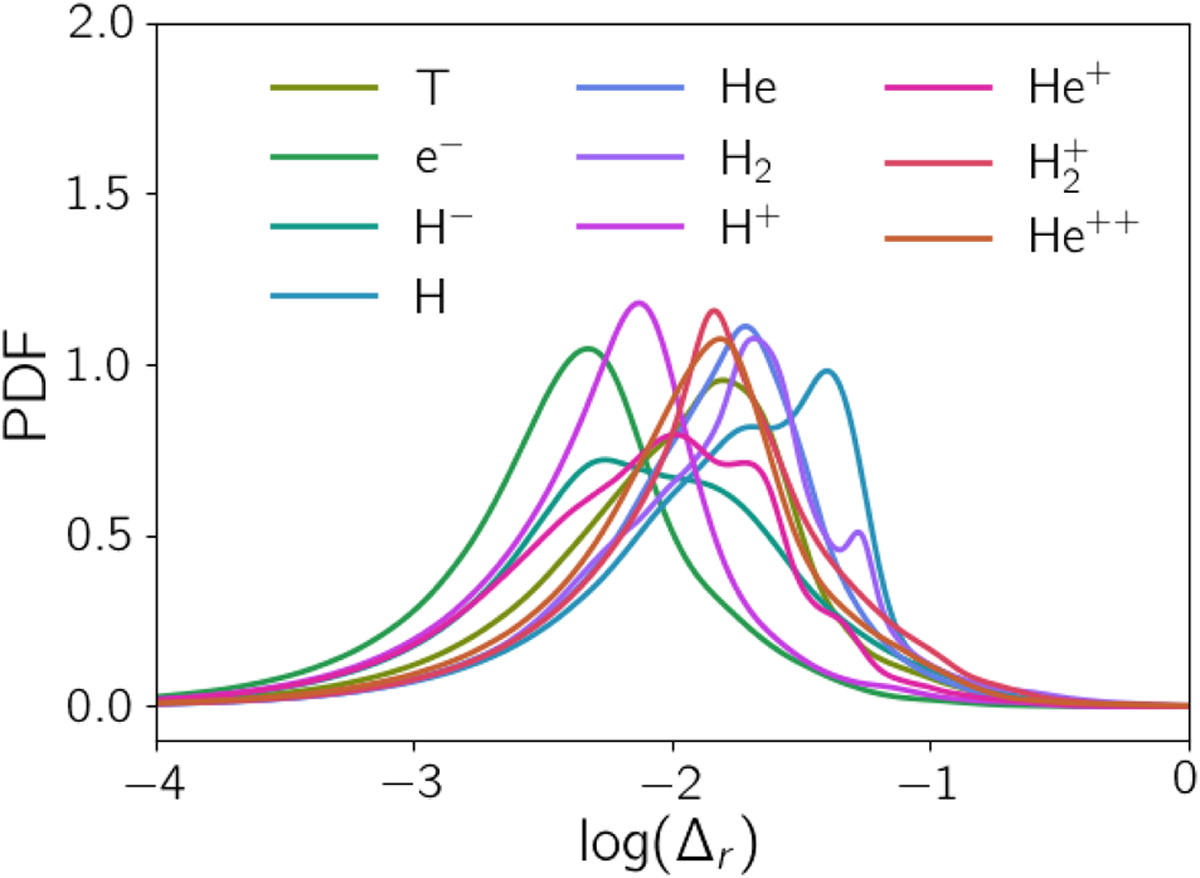
PDF of the relative error (∆r) for the testing set. Each output from the emulator (T and density for each species) is shown independently, with the color-code indicated in the legend. The PDFs are computed using a testing set of ≃2 × 10⁷ of points.
Current usage metrics show cumulative count of Article Views (full-text article views including HTML views, PDF and ePub downloads, according to the available data) and Abstracts Views on Vision4Press platform.
Data correspond to usage on the plateform after 2015. The current usage metrics is available 48-96 hours after online publication and is updated daily on week days.
Initial download of the metrics may take a while.