Fig. 2
Download original image
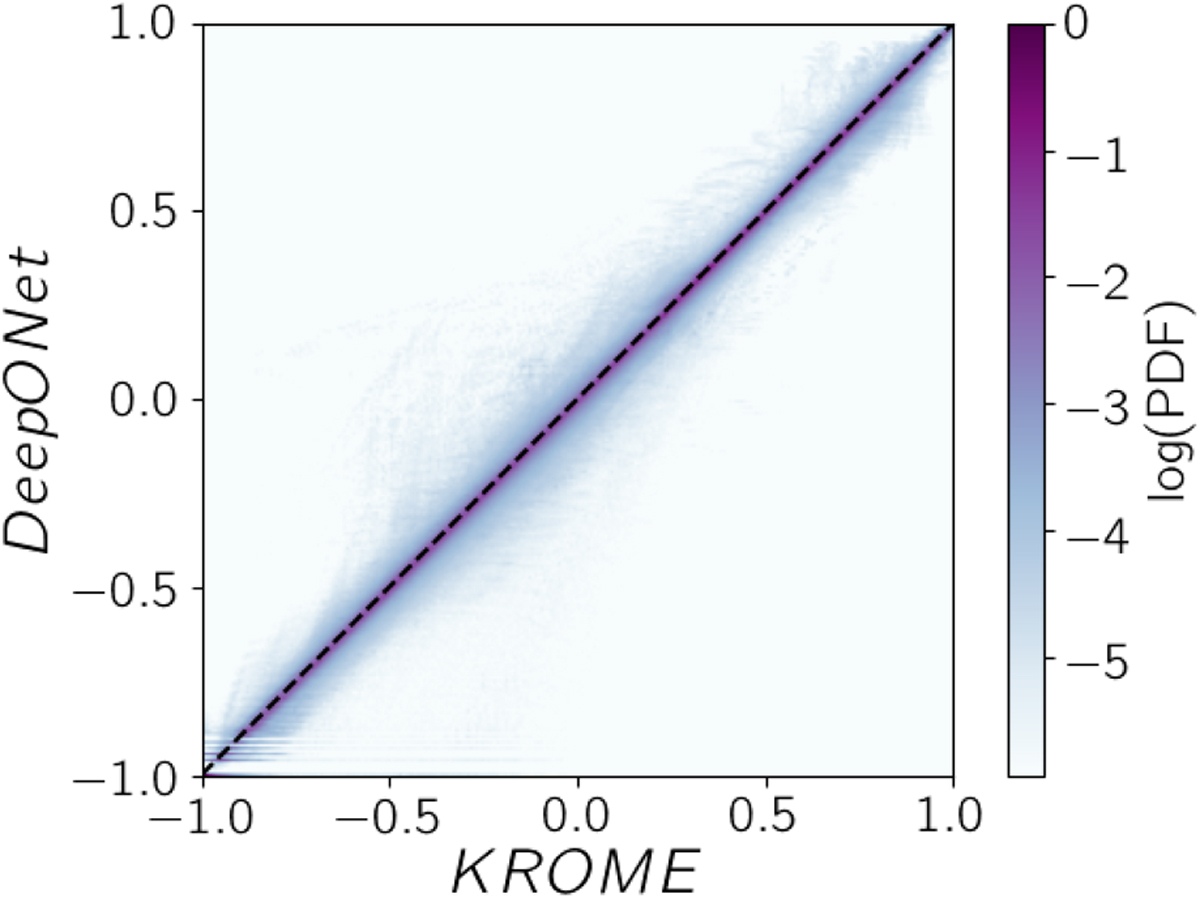
Predicted vs. true test for the DeepONet model. Logarithmic densities for each ion (H, H+, …) and the temperature (T) are normalized in the full dataset range (Table 2) and summed (y, see Eq. (4)) for both the true value from KROME and the predicted value from Deep-ONet. The image shows the 2D probability distribution function (PDF) of the summed dataset and it is normalized such that the maximum is 1 to better appreciate the dynamical range. To guide the eye, we have added a dashed black line to mark the KROME = DeepONet region. See Fig. A.2 for the same diagnostic for individual ions.
Current usage metrics show cumulative count of Article Views (full-text article views including HTML views, PDF and ePub downloads, according to the available data) and Abstracts Views on Vision4Press platform.
Data correspond to usage on the plateform after 2015. The current usage metrics is available 48-96 hours after online publication and is updated daily on week days.
Initial download of the metrics may take a while.