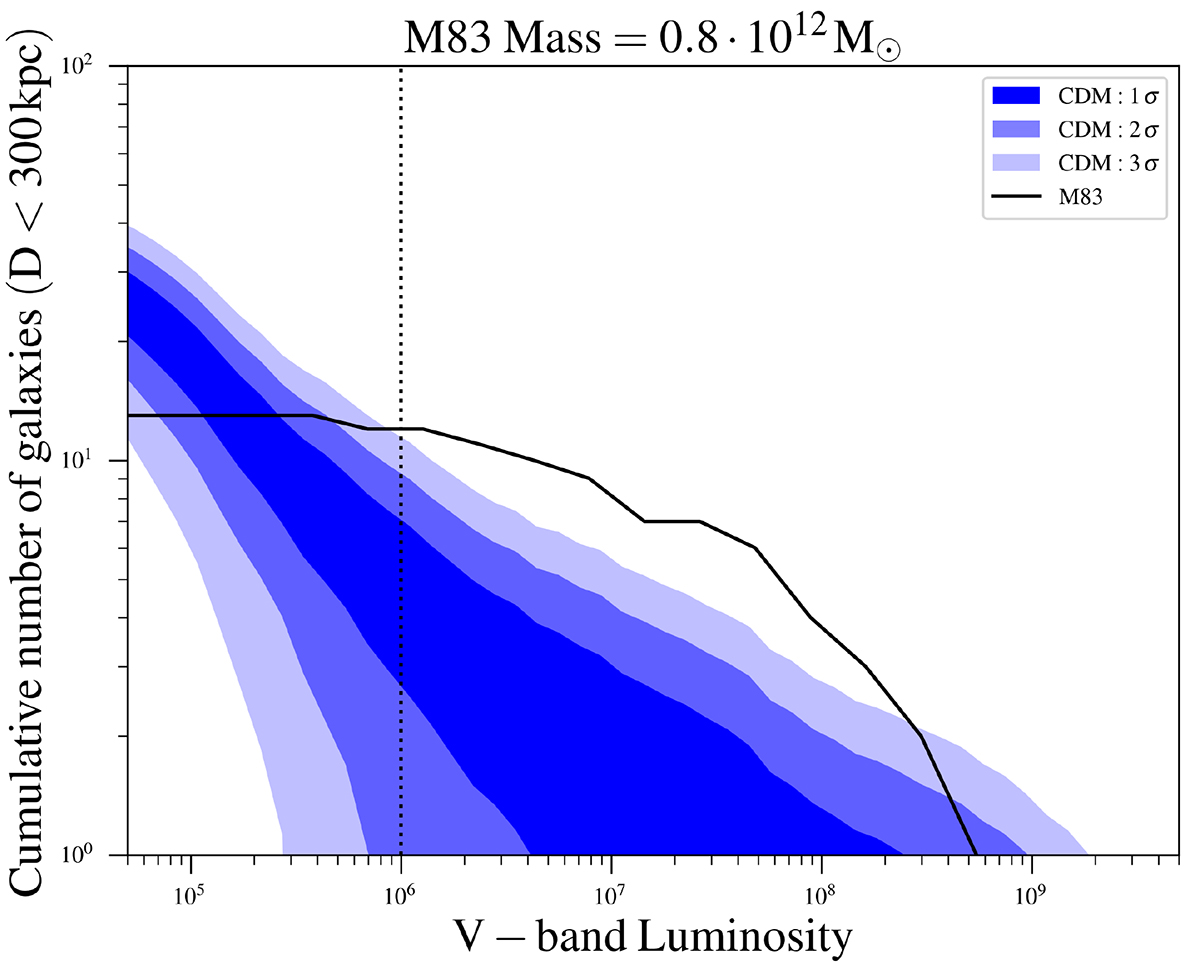
Fig. 5.
Download original image
Predicted cumulative number of satellites brighter than a given luminosity, within 300 kpc of M83, assuming a mass of 0.8 × 10¹² M⊙. The 1, 2, and 3σ confidence intervals are indicated with the blue areas. The black line corresponds to the LF of M 83. The vertical dashed line represents the survey limit of Müller et al. (2015). The M 83 LF deviates by more than 3σ from the subhalo mass function.
Current usage metrics show cumulative count of Article Views (full-text article views including HTML views, PDF and ePub downloads, according to the available data) and Abstracts Views on Vision4Press platform.
Data correspond to usage on the plateform after 2015. The current usage metrics is available 48-96 hours after online publication and is updated daily on week days.
Initial download of the metrics may take a while.