Open Access
Fig. 9
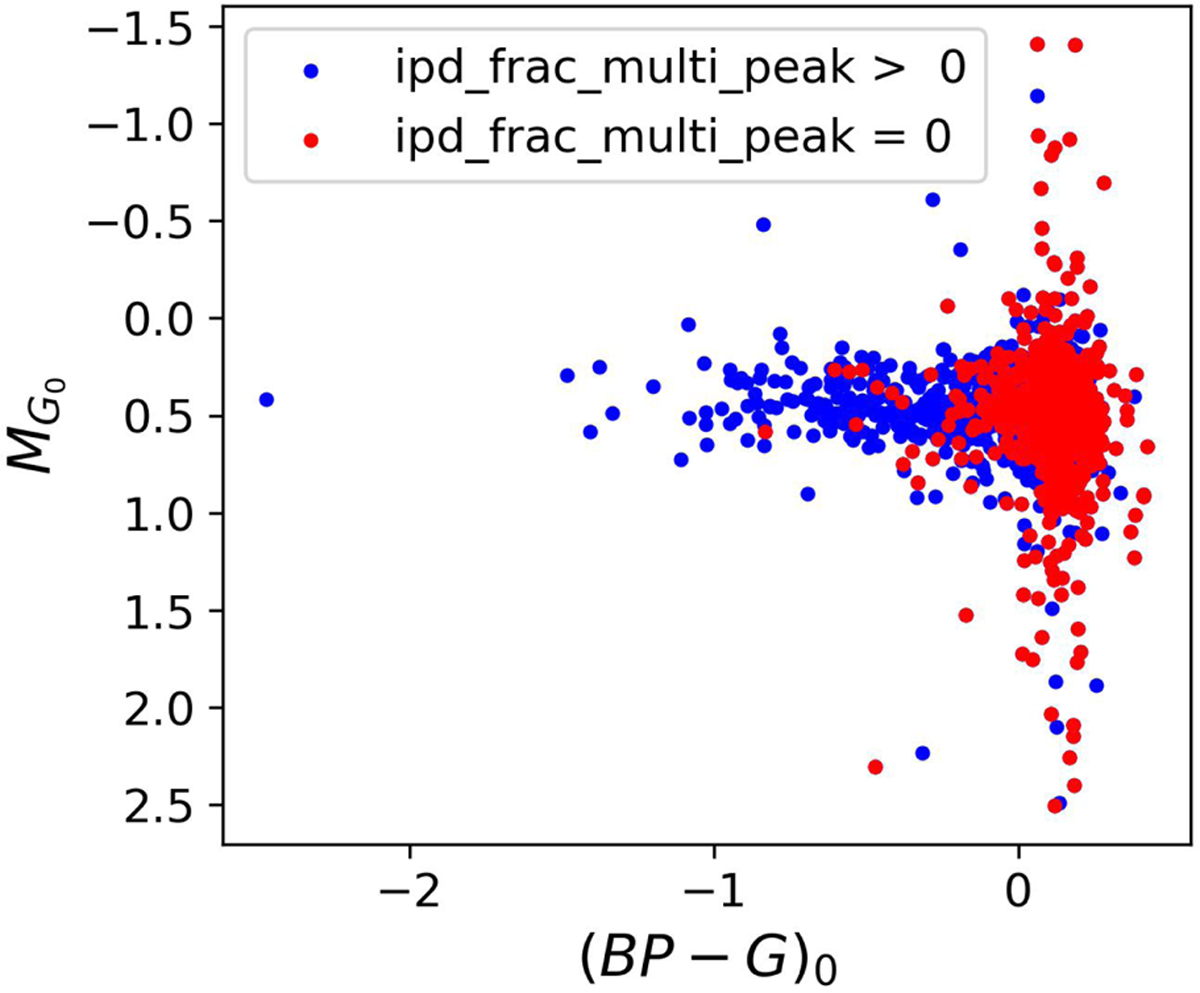
Download original image
Color–magnitude diagram for the RRLs in our final sample. It can be seen that multiple sources have an unexpected (BP − G)0 color, most of them have a nonzero value of ipd_peak_multi_frac, indicating that their photometry is likely affected by nearby sources.
Current usage metrics show cumulative count of Article Views (full-text article views including HTML views, PDF and ePub downloads, according to the available data) and Abstracts Views on Vision4Press platform.
Data correspond to usage on the plateform after 2015. The current usage metrics is available 48-96 hours after online publication and is updated daily on week days.
Initial download of the metrics may take a while.