Fig. 4
Download original image
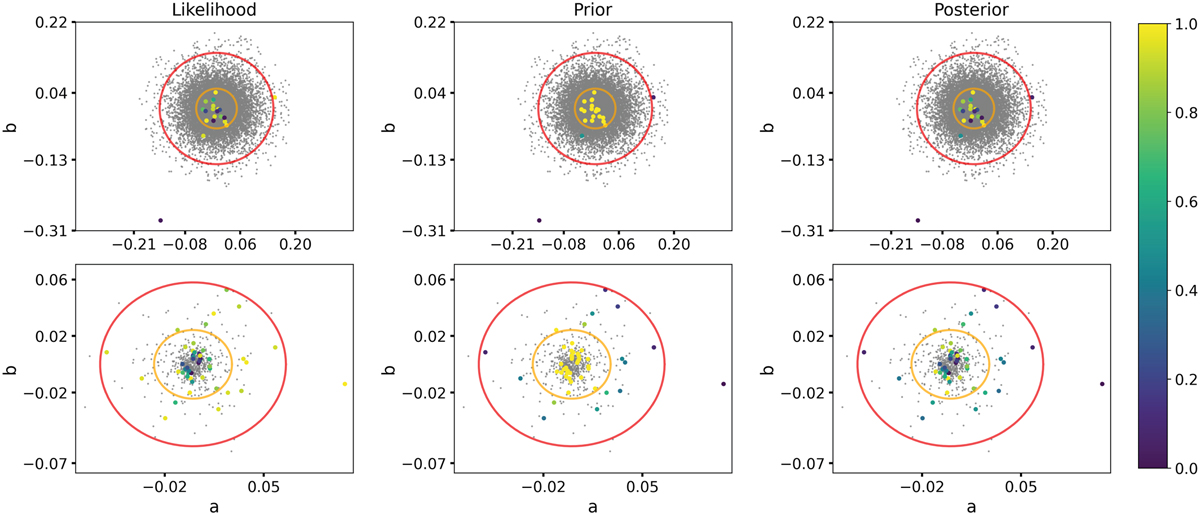
Cluster members of NGC 4833 and NGC 7006. The color bar represents the membership probability assigned to the RRLs with our method. All stars were rotated to align the axes of the plot with the minor and major axes of the ellipses obtained with the PCA analysis. The orange ellipse represents the core ellipse and the red one the limiting ellipse. Both of them were obtained using the method presented in Sect. 3.2 and relying on the sample of cluster members determined by VB21. At the limiting ellipse, only 10% of all stars are expected to be cluster members. Field stars are not shown in the plot.
Current usage metrics show cumulative count of Article Views (full-text article views including HTML views, PDF and ePub downloads, according to the available data) and Abstracts Views on Vision4Press platform.
Data correspond to usage on the plateform after 2015. The current usage metrics is available 48-96 hours after online publication and is updated daily on week days.
Initial download of the metrics may take a while.