Open Access
Fig. 16
Download original image
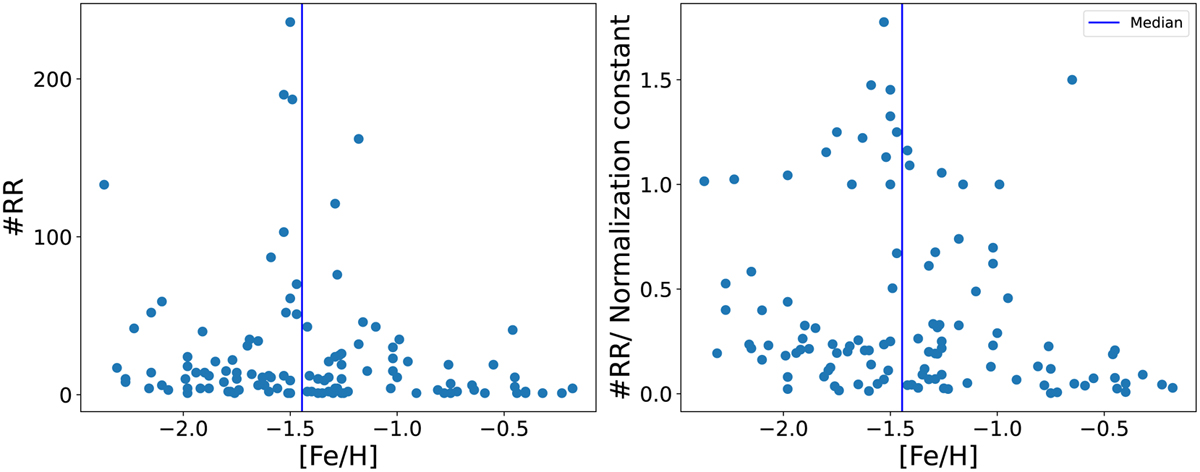
Number of RRLs in clusters. The panel illustrates the number of RRLs within each cluster as a function of the iron abundance. The right panel presents the same data, but the number of RRLs is divided by a normalization constant that is calculated individually for each cluster (refer to Sect. 5.2 for more details).
Current usage metrics show cumulative count of Article Views (full-text article views including HTML views, PDF and ePub downloads, according to the available data) and Abstracts Views on Vision4Press platform.
Data correspond to usage on the plateform after 2015. The current usage metrics is available 48-96 hours after online publication and is updated daily on week days.
Initial download of the metrics may take a while.