Fig. 14
Download original image
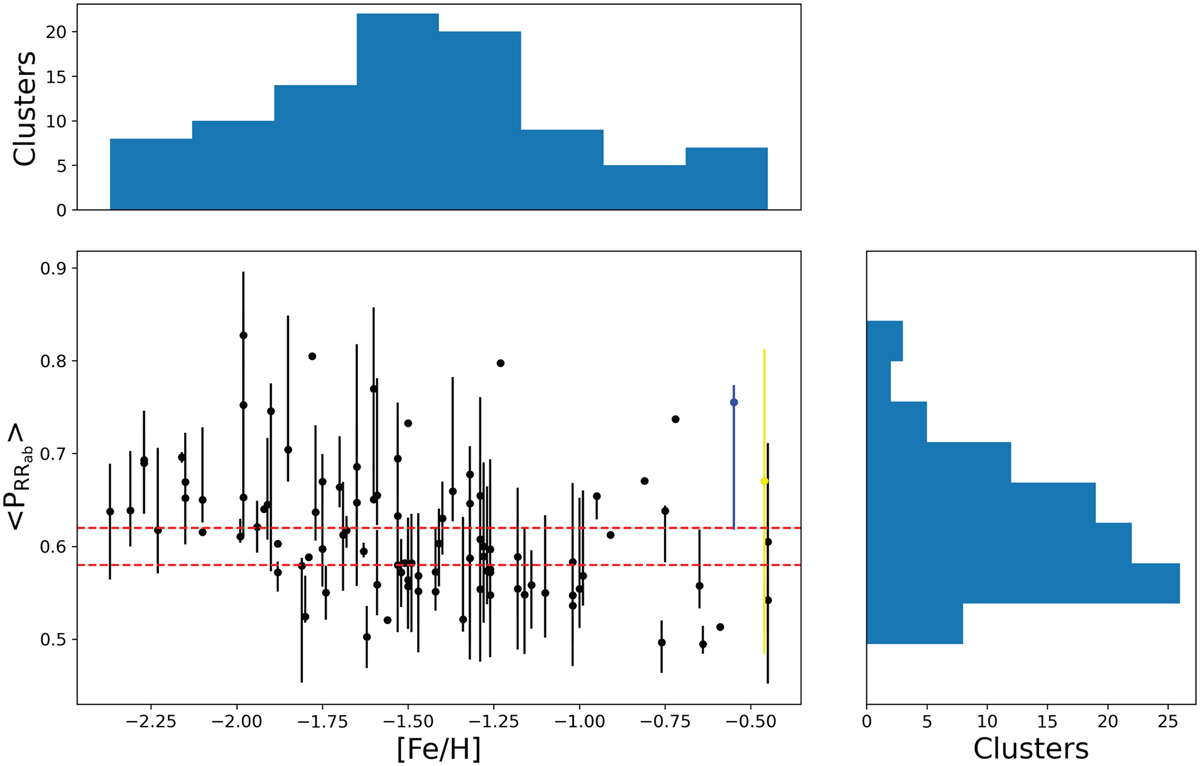
Mean period of the RRLs pulsating in the fundamental mode as a function of the iron abundance of the cluster. The dotted lines indicate the region known as the Oosterhoff gap, we can see that multiple clusters are located in this region. The error bars represent the 16th and 84th percentiles of the distribution of periods. The blue point represents NGC 6388, and the yellow one corresponds to NGC 6441. Both clusters have been classified as Oosterhoff type III in the literature (Pritzl et al. 2003; Bhardwaj 2022).
Current usage metrics show cumulative count of Article Views (full-text article views including HTML views, PDF and ePub downloads, according to the available data) and Abstracts Views on Vision4Press platform.
Data correspond to usage on the plateform after 2015. The current usage metrics is available 48-96 hours after online publication and is updated daily on week days.
Initial download of the metrics may take a while.