Fig. 13
Download original image
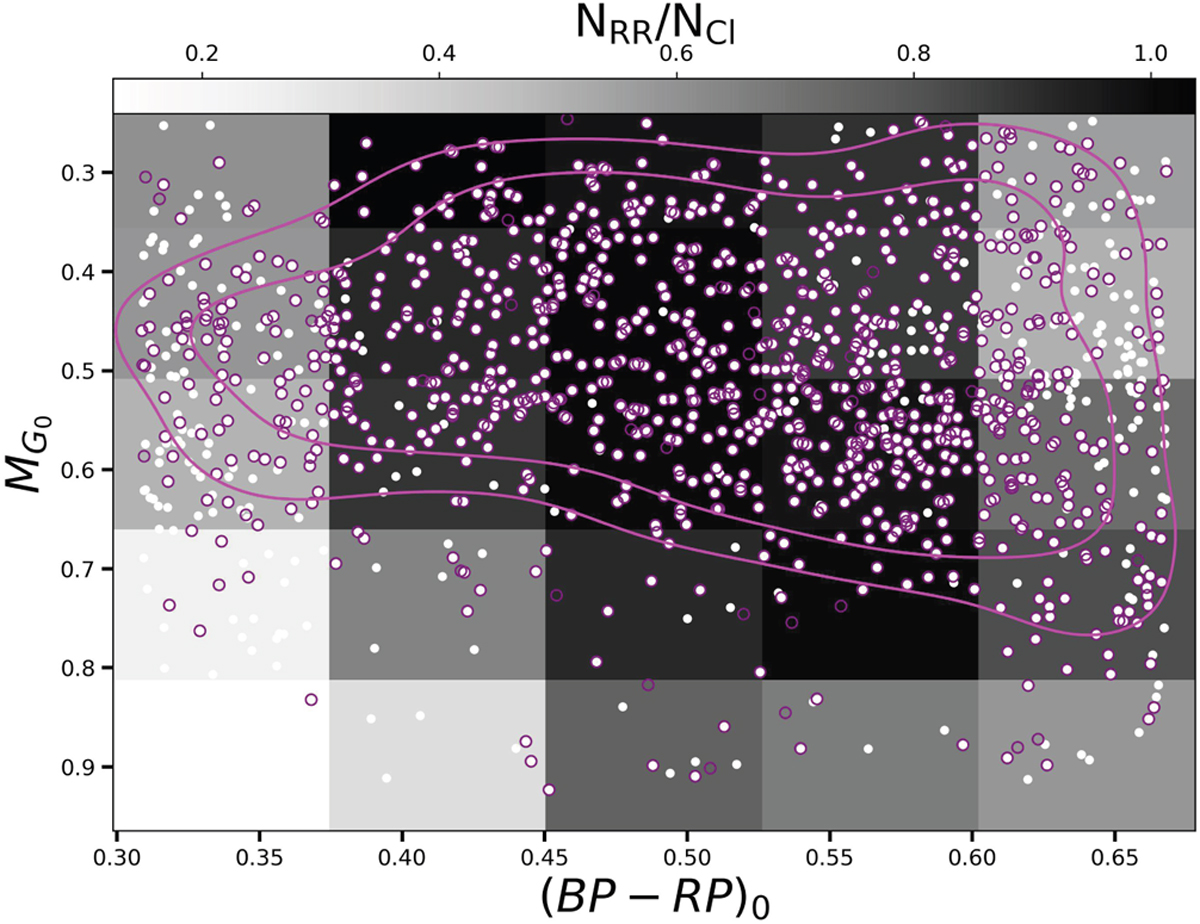
RRLs (pink open circles) in clusters detected in this study and cluster members (white dots) in the HB detected by VB21 with membership probabilities above 50%. The squares indicate the bins in color and absolute magnitude used to estimate the fraction of RRLs over the number of cluster members detected by VB21. Each bin was color coded according to its specific RRL fraction, the color bar is located at the top of the plot. The purple contours indicate the 68th and 84th percentiles of density of RRLs.
Current usage metrics show cumulative count of Article Views (full-text article views including HTML views, PDF and ePub downloads, according to the available data) and Abstracts Views on Vision4Press platform.
Data correspond to usage on the plateform after 2015. The current usage metrics is available 48-96 hours after online publication and is updated daily on week days.
Initial download of the metrics may take a while.