Fig. 11
Download original image
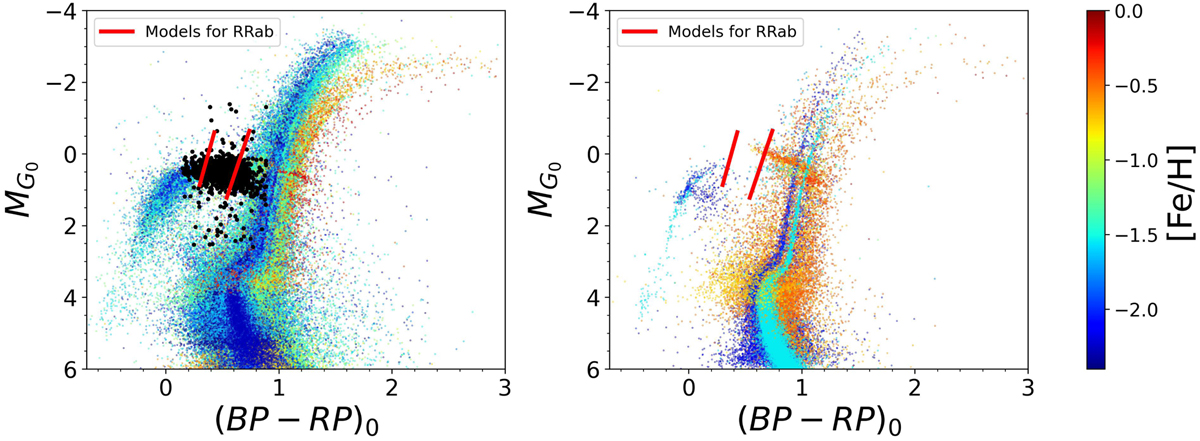
Color-magnitude diagram for the clusters in our sample E(B − V) < 1, color coded with their mean iron abundance. The plot on the left displays 103 GCs that contain at least one RRL. The right plot shows the same but for 24 clusters without RRLs. The red lines indicate the position of the theoretical blue and red edge of the instability strip for RRab, with Z = 0.0003, M = 0.7M⊙ and Y = 0.290, see Sect. 5.
Current usage metrics show cumulative count of Article Views (full-text article views including HTML views, PDF and ePub downloads, according to the available data) and Abstracts Views on Vision4Press platform.
Data correspond to usage on the plateform after 2015. The current usage metrics is available 48-96 hours after online publication and is updated daily on week days.
Initial download of the metrics may take a while.