Fig. 10
Download original image
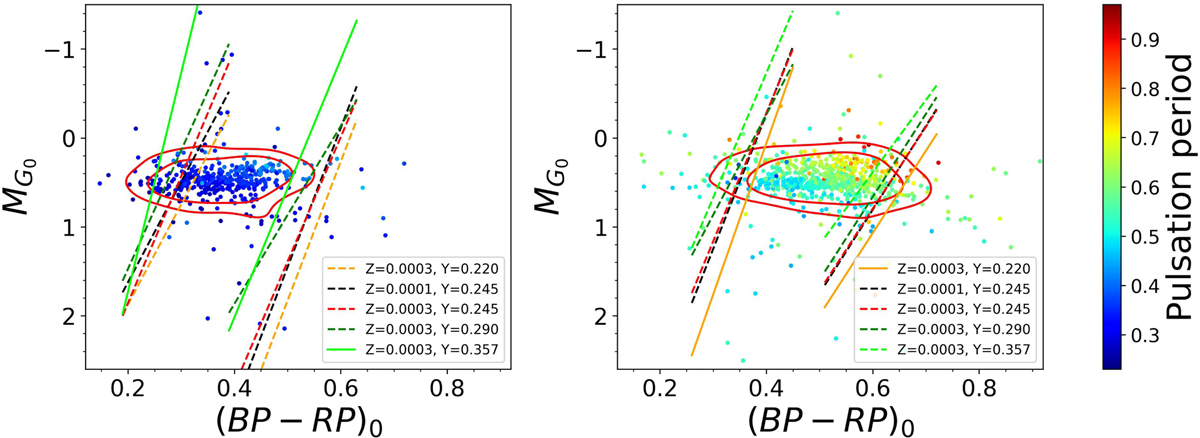
RRLs in the color-magnitude diagram color coded with their pulsation period. The first panel shows the RRc stars and the second panel shows the RRab. The color bar represent the pulsation period of the stars and the contours the 68th and 84th percentiles of density of RRL. All models assume M = 0.7 M⊙. The dotted lines are the theoretical models for the blue and red edge of the instabillity strip of RRc and RRab stars respectively. The solid lines highlight the models that best fit the observations.
Current usage metrics show cumulative count of Article Views (full-text article views including HTML views, PDF and ePub downloads, according to the available data) and Abstracts Views on Vision4Press platform.
Data correspond to usage on the plateform after 2015. The current usage metrics is available 48-96 hours after online publication and is updated daily on week days.
Initial download of the metrics may take a while.