Open Access
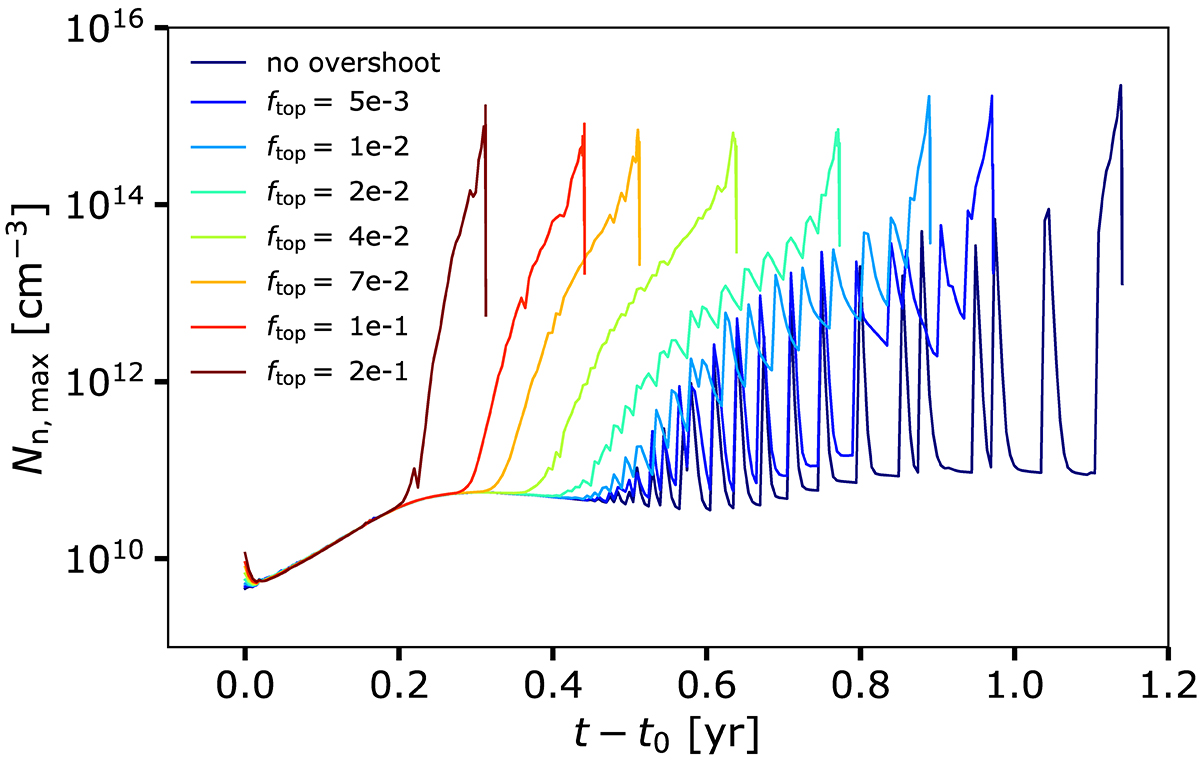
Fig. 2.
Download original image
Evolution of maximal neutron density during a PIE. The different lines correspond to different values of the overshoot coefficient at the top of the convective pulse (ftop). The evolution is illustrated between the time t0 at which Nn, max rises above 1010 cm−3 and ends when the convective pulse splits.
Current usage metrics show cumulative count of Article Views (full-text article views including HTML views, PDF and ePub downloads, according to the available data) and Abstracts Views on Vision4Press platform.
Data correspond to usage on the plateform after 2015. The current usage metrics is available 48-96 hours after online publication and is updated daily on week days.
Initial download of the metrics may take a while.