Open Access
Fig. 10.
Download original image
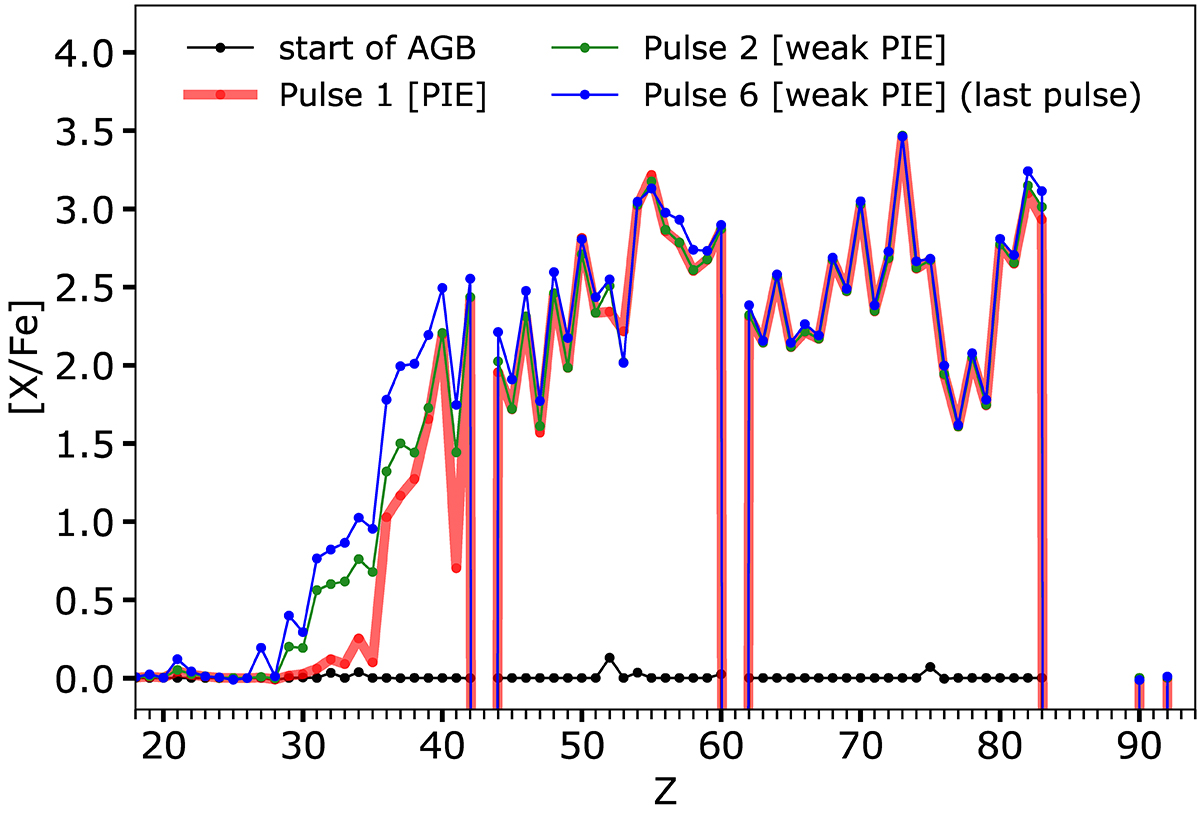
Surface [X/Fe] ratios in the M2.0z1.5_f10 model at four different times. Abundances are shown after the dredge up following the indicated pulse number (except for the black pattern that corresponds to the start of the AGB phase).
Current usage metrics show cumulative count of Article Views (full-text article views including HTML views, PDF and ePub downloads, according to the available data) and Abstracts Views on Vision4Press platform.
Data correspond to usage on the plateform after 2015. The current usage metrics is available 48-96 hours after online publication and is updated daily on week days.
Initial download of the metrics may take a while.