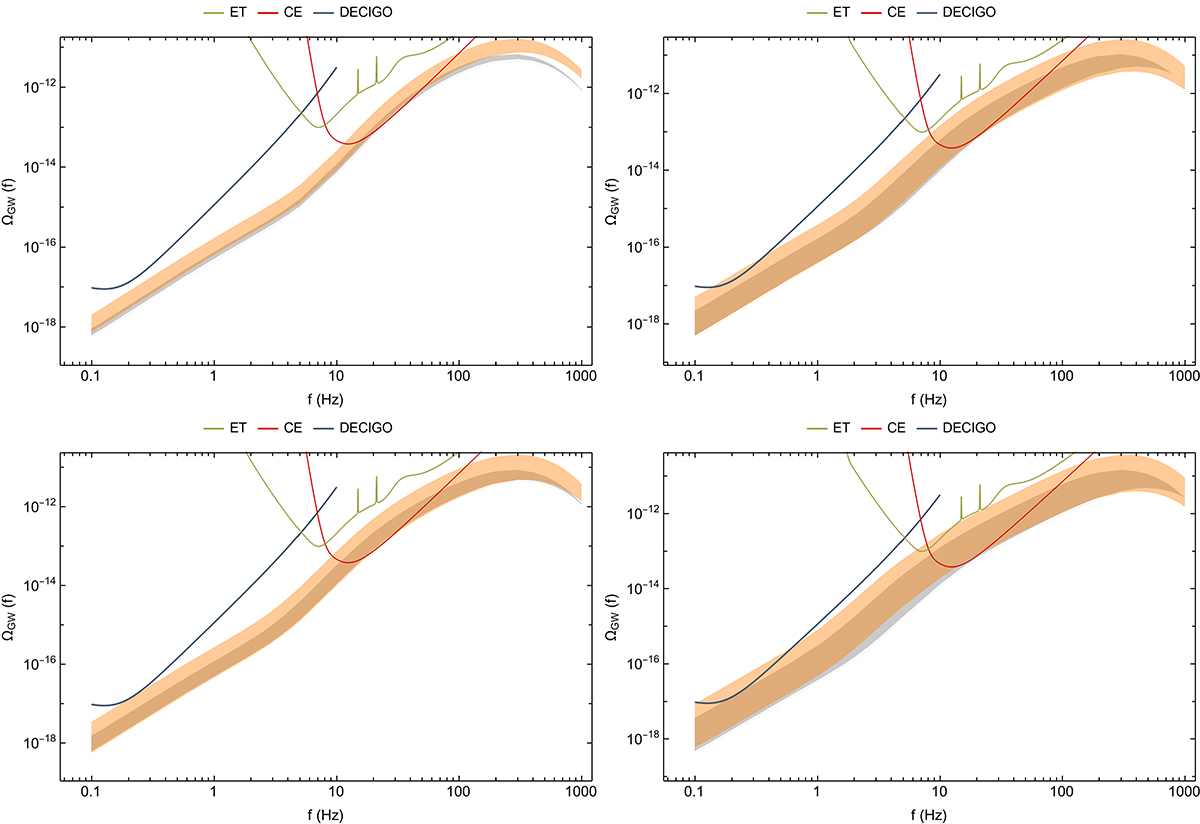
Fig. 2.
Download original image
SGWB as detected using weakly hyperbolic encounters. The shaded regions show the SGWB and are produced from Eq. (46), where we set ri in two sets of ranges. The small range varies from {0.03 pc, 0.53 pc}, and the larger range varies from {0.03 pc, 9.03 pc}. In both cases, the eccentricity covers the range of }eimin,eimin + 4 × 10⁻⁹{. For the top-left plot, we set Ntot = 106, Rgc = 10 pc (see case 1 in the text for more details.); for the top-right plot, we set Ntot = 5 × 10⁵, Rgc = 10 pc (see case 2 for more details); for the bottom-left plot, we set Ntot = 106, Rgc = 15 pc (see case 3 for more details); for the bottom- right plot, we set Ntot = 5 × 10⁵, Rgc = 15 pc (see case 4 for more details). In all four cases, we integrate up to redshift z = 5. The gray region shows the case for the small ri and the orange region shows the case for the larger ri. Moreover, ET, CE, and DECIGO curves correspond to the sensitivity of the Einstein Telescope (Punturo et al. 2010), the Cosmic Explorer (Evans et al. 2021), and the Deci-hertz Interferometer Gravitational-wave Observatory (Hou et al. 2021) detectors, respectively, for one year of observation (Thrane & Romano 2013).
Current usage metrics show cumulative count of Article Views (full-text article views including HTML views, PDF and ePub downloads, according to the available data) and Abstracts Views on Vision4Press platform.
Data correspond to usage on the plateform after 2015. The current usage metrics is available 48-96 hours after online publication and is updated daily on week days.
Initial download of the metrics may take a while.