Open Access
Fig. 4.
Download original image
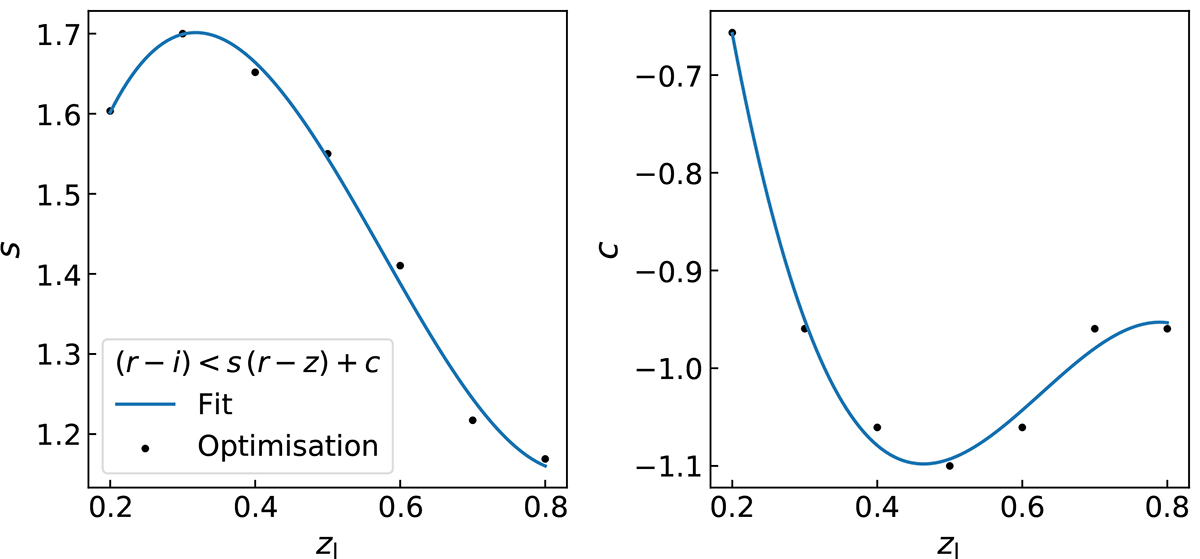
Values of s (left panel) and c (right panel) parameters, from Eq. (1), as a function of zl for the colour condition quoted in the left panel legend. The black dots represent the optimal values of s and c, while the blue curves represent the polynomial fits.
Current usage metrics show cumulative count of Article Views (full-text article views including HTML views, PDF and ePub downloads, according to the available data) and Abstracts Views on Vision4Press platform.
Data correspond to usage on the plateform after 2015. The current usage metrics is available 48-96 hours after online publication and is updated daily on week days.
Initial download of the metrics may take a while.