Open Access
Fig. 2.
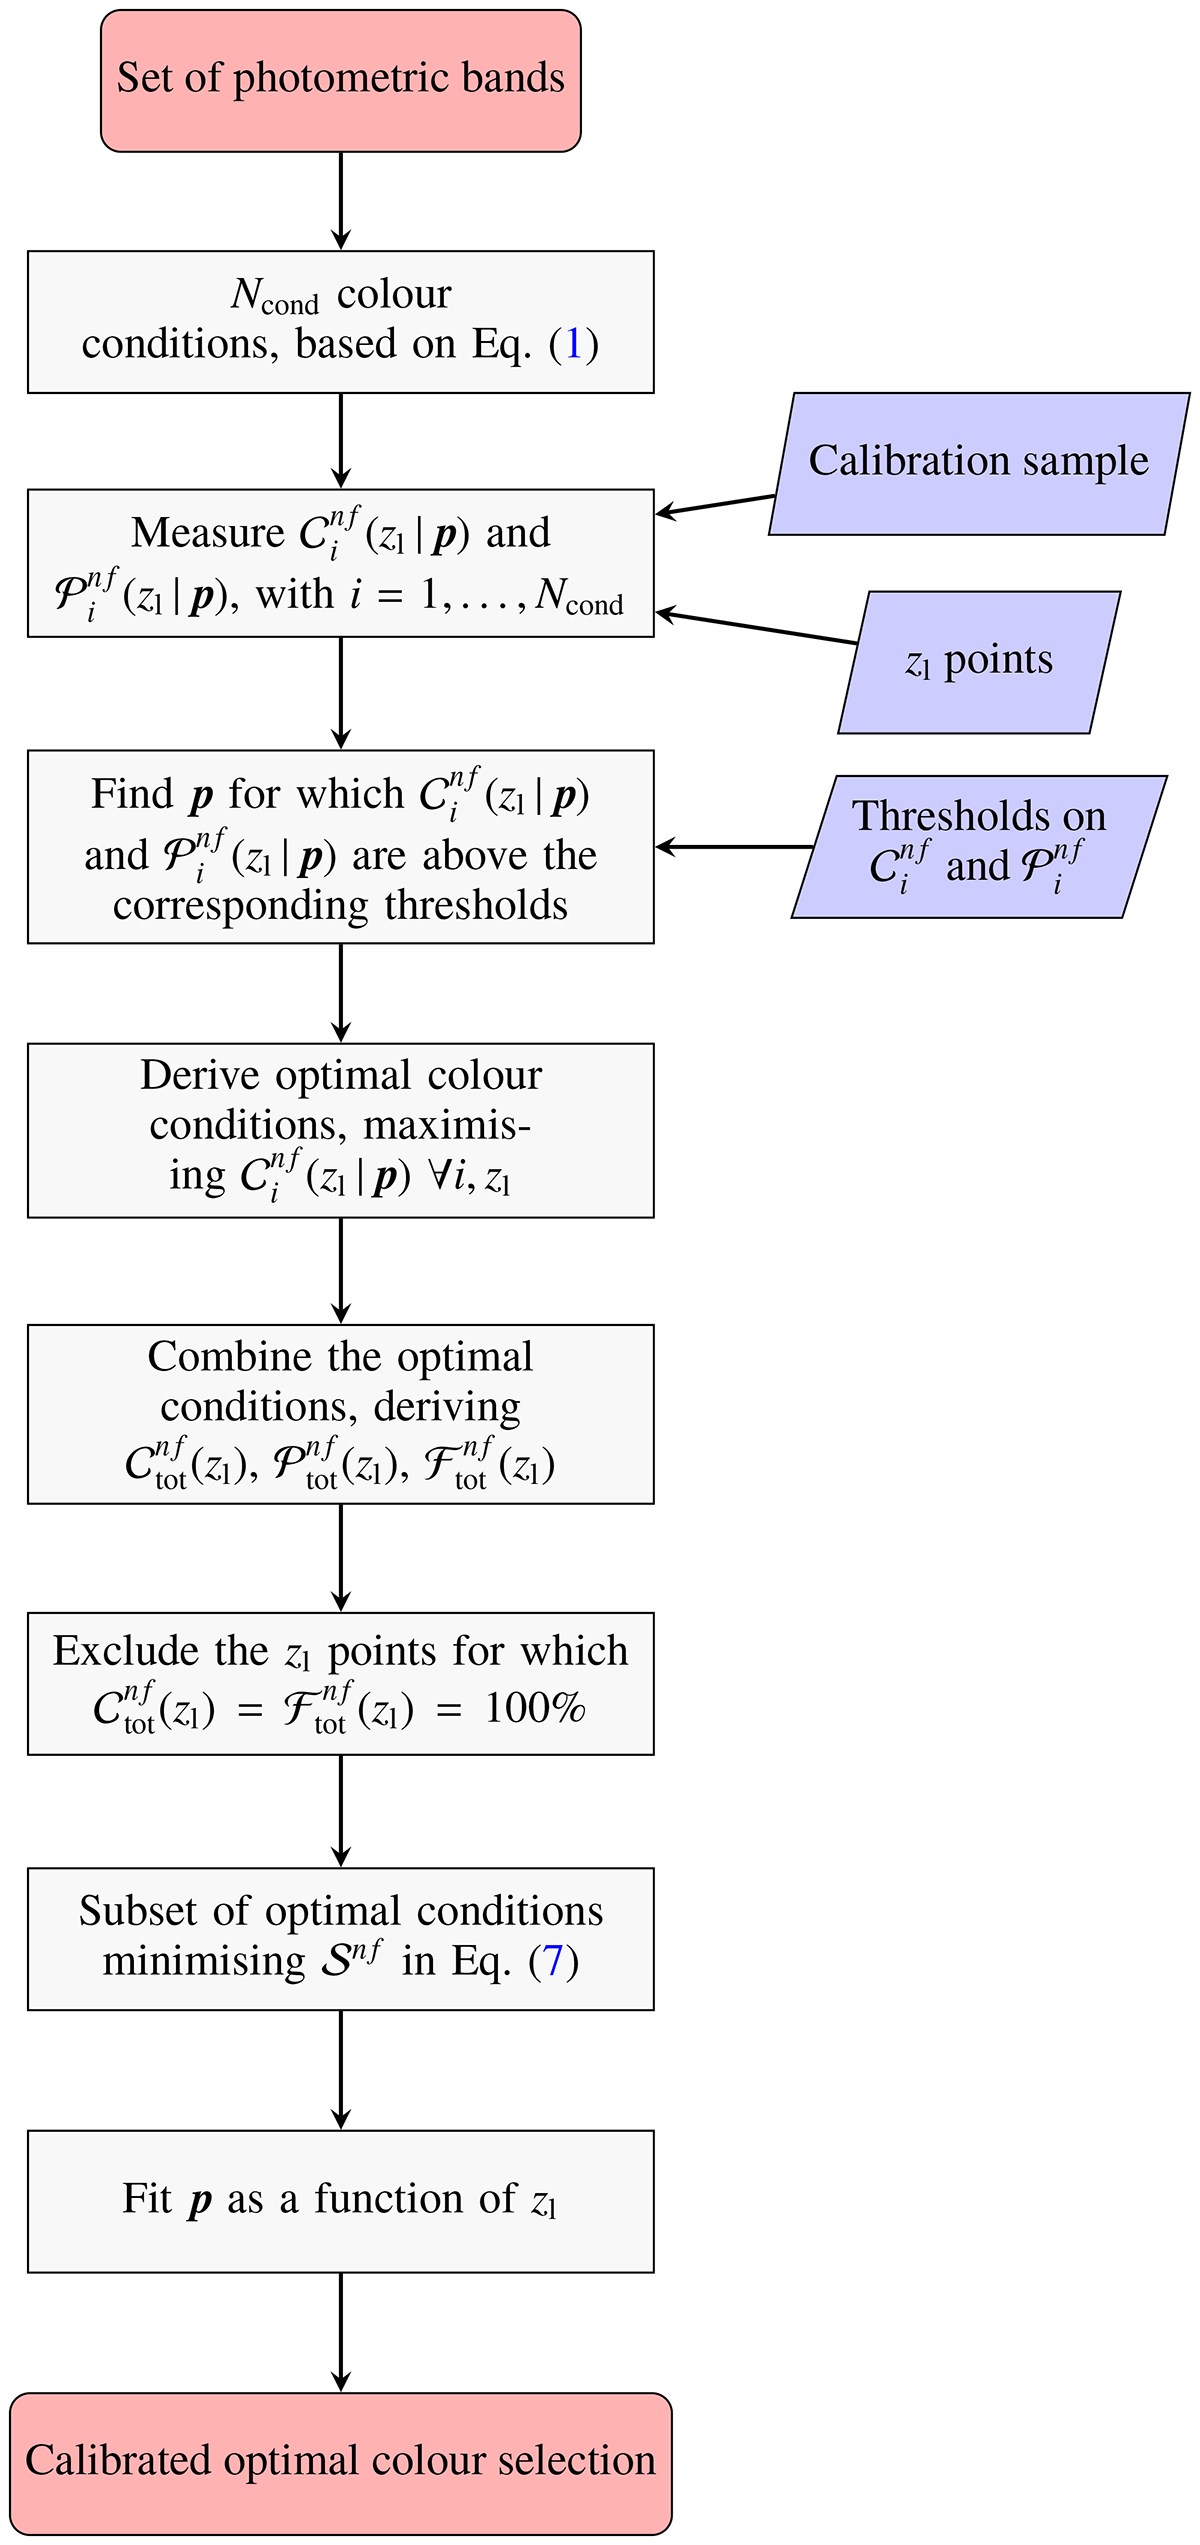
Download original image
Flowchart summarising the calibration process described in Sect. 3. Round red rectangles represent the start and end points of the calibration process. Grey rectangles represent processing steps, while blue trapezoids correspond to the inputs.
Current usage metrics show cumulative count of Article Views (full-text article views including HTML views, PDF and ePub downloads, according to the available data) and Abstracts Views on Vision4Press platform.
Data correspond to usage on the plateform after 2015. The current usage metrics is available 48-96 hours after online publication and is updated daily on week days.
Initial download of the metrics may take a while.