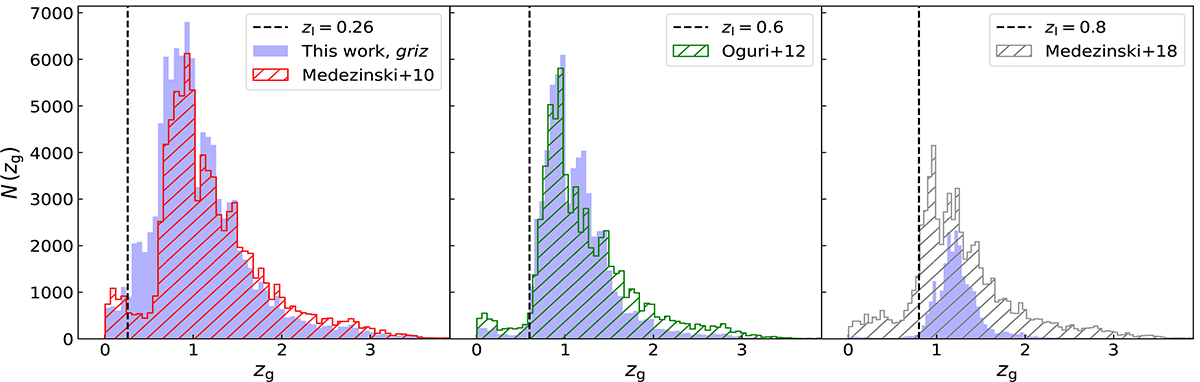
Fig. 13.
Download original image
From left to right: number of selected galaxies as a function of zg assuming zl = 0.26, zl = 0.6, and zl = 0.8. The zl values are represented by vertical black dashed lines. The blue histograms represent the griz selection calibrated in this work. The galaxy redshift distributions derived with the Medezinski et al. (2010, 2018) and Oguri et al. (2012), selections are represented by red, green, and grey hatched histograms, respectively.
Current usage metrics show cumulative count of Article Views (full-text article views including HTML views, PDF and ePub downloads, according to the available data) and Abstracts Views on Vision4Press platform.
Data correspond to usage on the plateform after 2015. The current usage metrics is available 48-96 hours after online publication and is updated daily on week days.
Initial download of the metrics may take a while.