Fig. 11.
Download original image
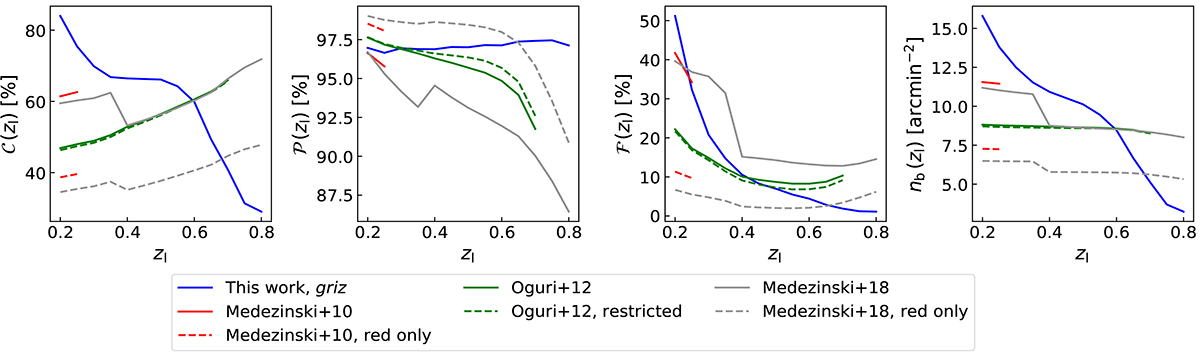
Comparison of the griz selection described in Sect. 4.1 with literature colour selections. From left to right: completeness, purity, foreground failure rate, and background density, derived from the B20 catalogue. The blue solid lines represent the griz selection derived in this work. The red curves refer to the Medezinski et al. (2010) selection, where the solid lines are given by Eqs. (11)–(12), while the dashed lines are given by Eq. (11). The green curves represent the results from the Oguri et al. (2012) selection, where the solid lines are given by Eqs. (13)–(16), while the dashed lines are given by Eqs. (13)–(15). The grey curves refer to the Medezinski et al. (2018) selection, where the solid lines are given by Eqs. (17)–(18), while the dashed lines are given by Eq. (17).
Current usage metrics show cumulative count of Article Views (full-text article views including HTML views, PDF and ePub downloads, according to the available data) and Abstracts Views on Vision4Press platform.
Data correspond to usage on the plateform after 2015. The current usage metrics is available 48-96 hours after online publication and is updated daily on week days.
Initial download of the metrics may take a while.