Fig. 8.
Download original image
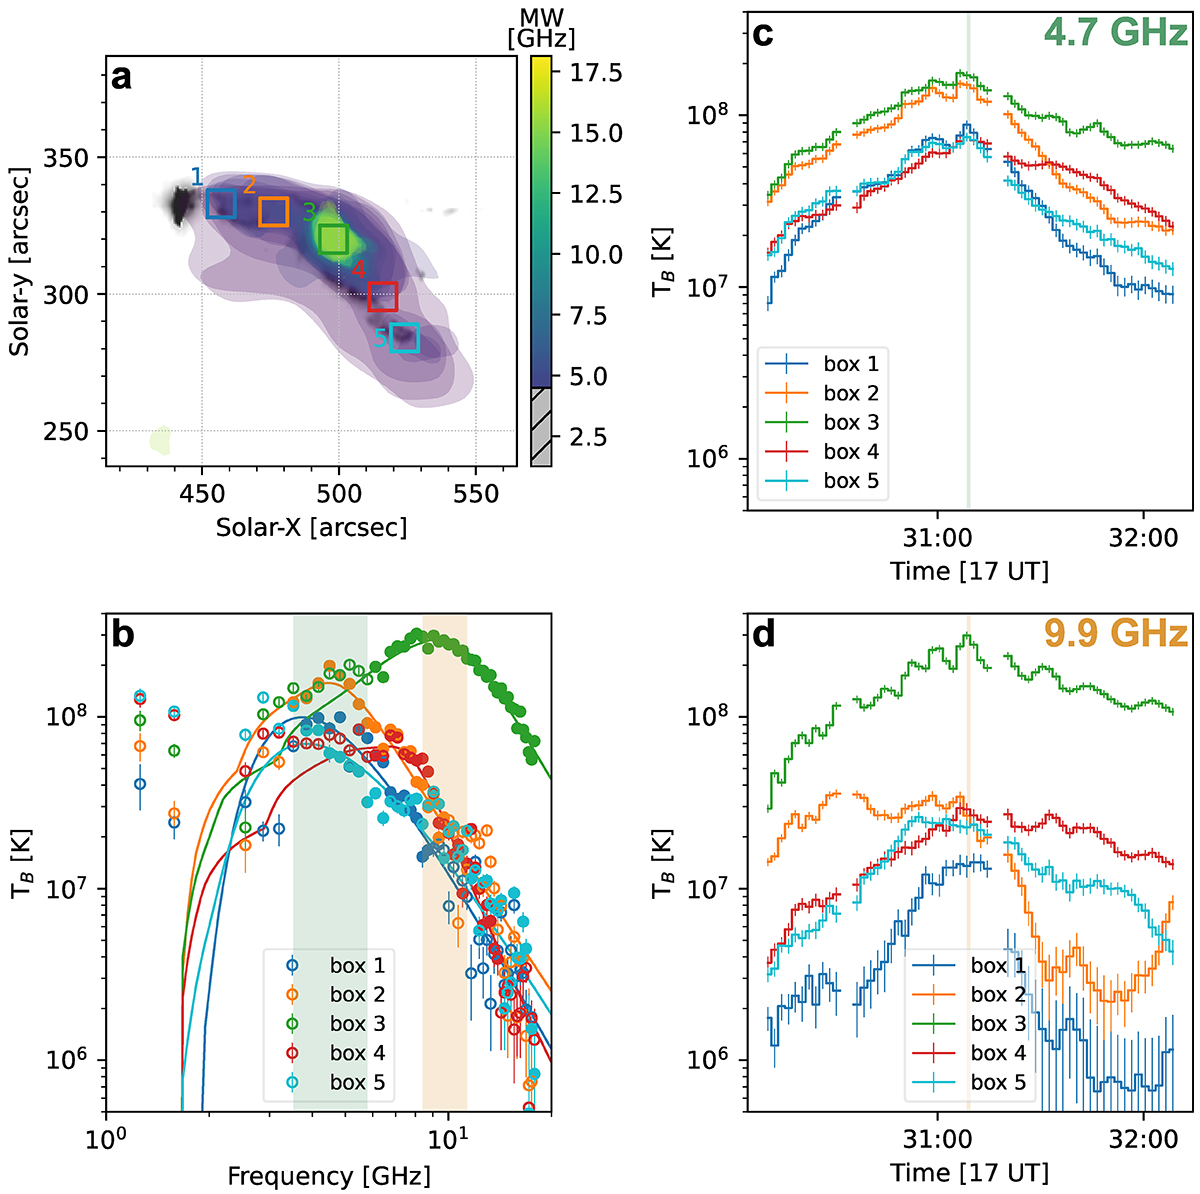
Spatially resolved microwave spectral analysis for Phase 1. Panel a displays the AIA 1600 Å maps overlaid with 25% contours from the EOVSA microwave map, ranging from 3.5−18 GHz, captured at 17:31:08 UT (corresponding to peak No. 5 in Table 1). The five distinct boxes mark regions selected for spectral fitting. Panel b illustrates the brightness temperature spectra from the five regions at 17:31:08 UT. Spectra are colour-coded to match the boxes in panel a. The colour-matching curves (in green and orange colours) represent best-fit models derived from homogeneous gyrosynchrotron emission due to non-thermal electrons with a single power-law distribution. The open circles denote data points excluded for the spectral fit. Panels c and d provide EOVSA spatially resolved time profiles from the five chosen regions, each averaged over specific frequency ranges. Panel c emphasises the range 3.5−5.8 GHz, as highlighted by the green shaded area in panel a, with a median frequency of 4.7 GHz. Similarly, Panel d highlights the frequency band in the range of 8.4−11.3 GHz marked by the yellow shading in panel a, with a median frequency of 9.9 GHz.
Current usage metrics show cumulative count of Article Views (full-text article views including HTML views, PDF and ePub downloads, according to the available data) and Abstracts Views on Vision4Press platform.
Data correspond to usage on the plateform after 2015. The current usage metrics is available 48-96 hours after online publication and is updated daily on week days.
Initial download of the metrics may take a while.