Fig. 6.
Download original image
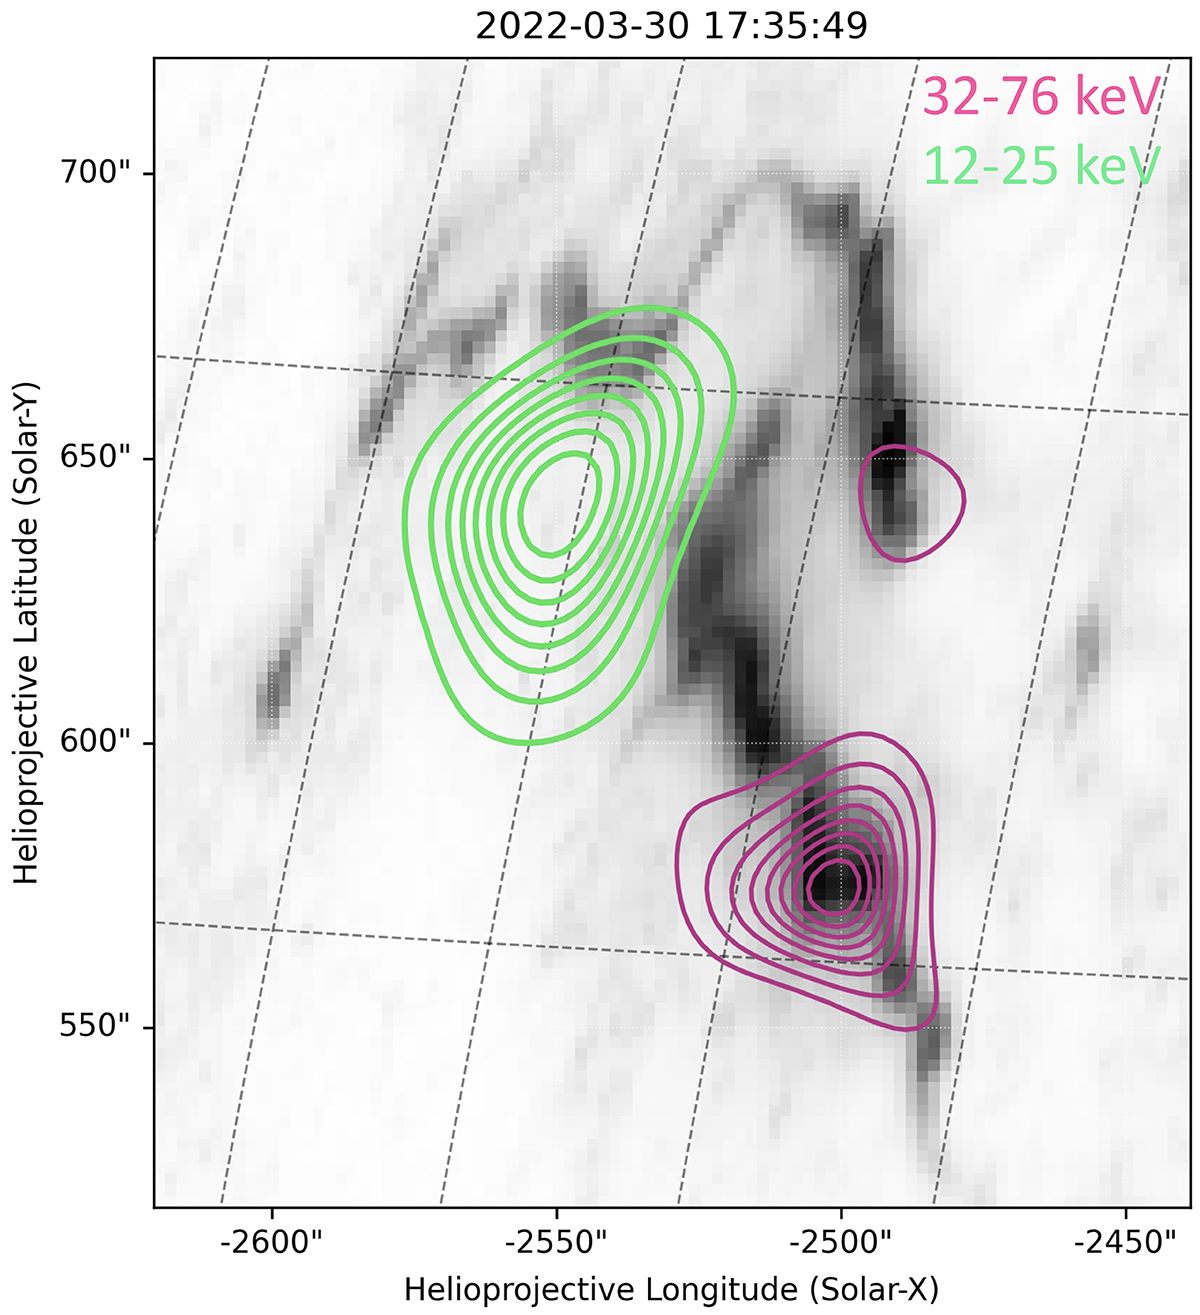
An AIA 1600 Å map with 12−25 keV thermal and 32−76 keV non-thermal MEM_GE STIX contours overlaid for the third phase of pulsations. The image is shown in the Solar Orbiter reference frame. The centre of the image interval from STIX is at 17:35:49. At this late phase, the standard flare cartoon with two non-thermal footpoints and connecting thermal loop-top emission represents the observations well.
Current usage metrics show cumulative count of Article Views (full-text article views including HTML views, PDF and ePub downloads, according to the available data) and Abstracts Views on Vision4Press platform.
Data correspond to usage on the plateform after 2015. The current usage metrics is available 48-96 hours after online publication and is updated daily on week days.
Initial download of the metrics may take a while.