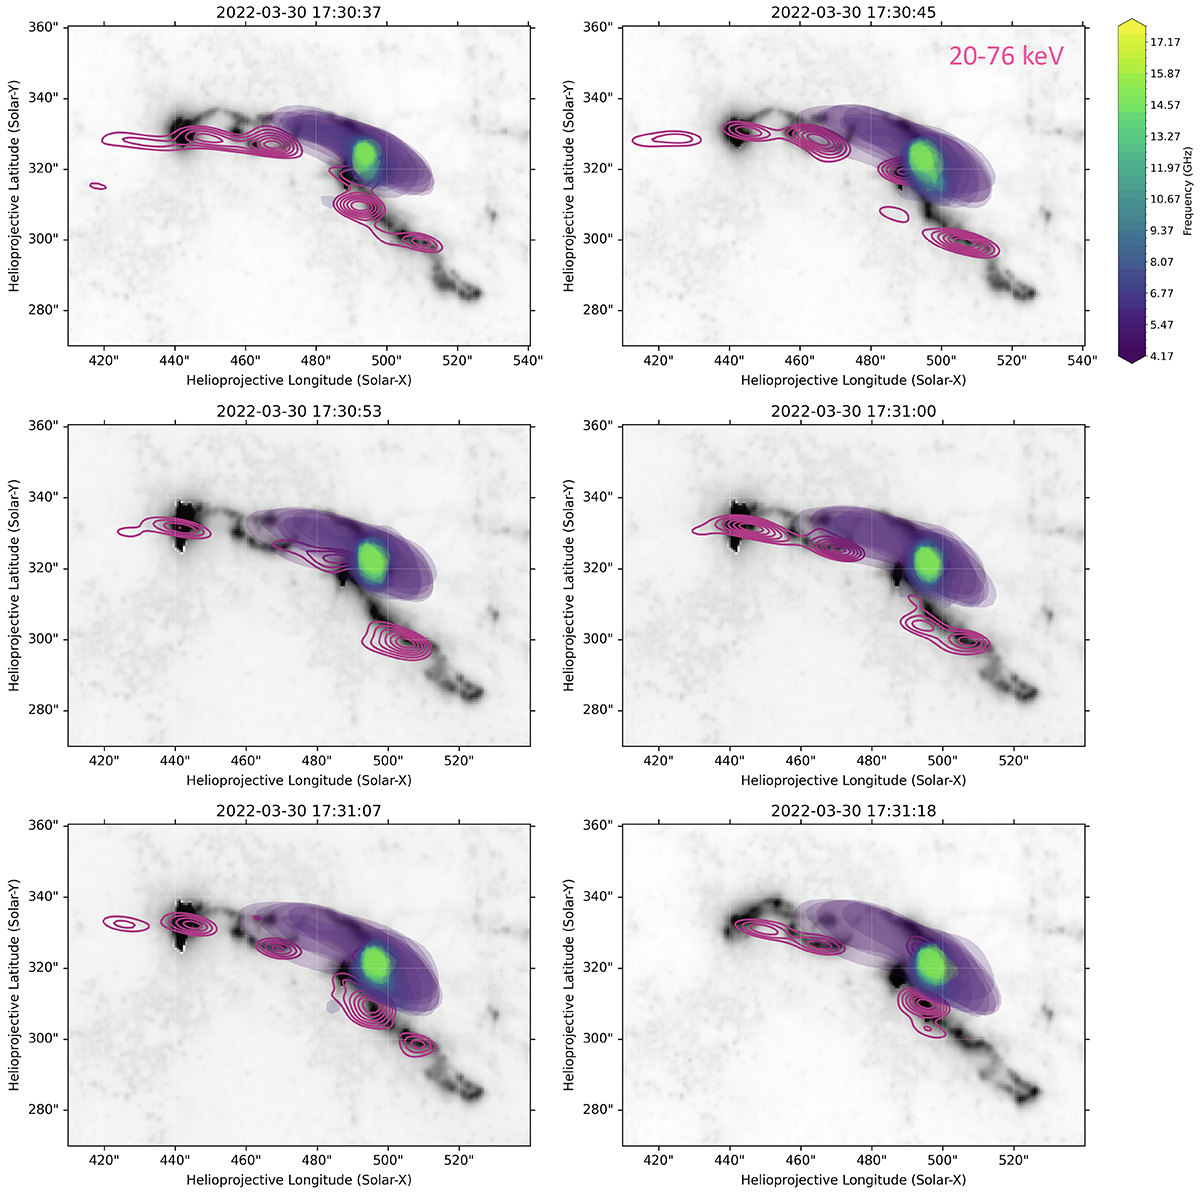
Fig. 5.
Download original image
AIA 1600 Å maps with 20−76 keV STIX Clean map 40−90% contours overlaid and 60−90% EOVSA microwave contours observed at frequencies ranging from 4 to 18 GHz, with the colour map ranging from purple to yellow in increasing frequency. Each image corresponds to a single HXR peak in phase 1 as determined by the Gaussian decomposition method in Collier et al. (2023). The integration time for each image is the FWHM of the fitted Gaussian burst. The time shown above each frame is the mean time of the burst at Earth in UTC, which is indicated by vertical dashed lines in Fig. 2. The AIA maps closest in time after the centre of each STIX image interval is shown.
Current usage metrics show cumulative count of Article Views (full-text article views including HTML views, PDF and ePub downloads, according to the available data) and Abstracts Views on Vision4Press platform.
Data correspond to usage on the plateform after 2015. The current usage metrics is available 48-96 hours after online publication and is updated daily on week days.
Initial download of the metrics may take a while.