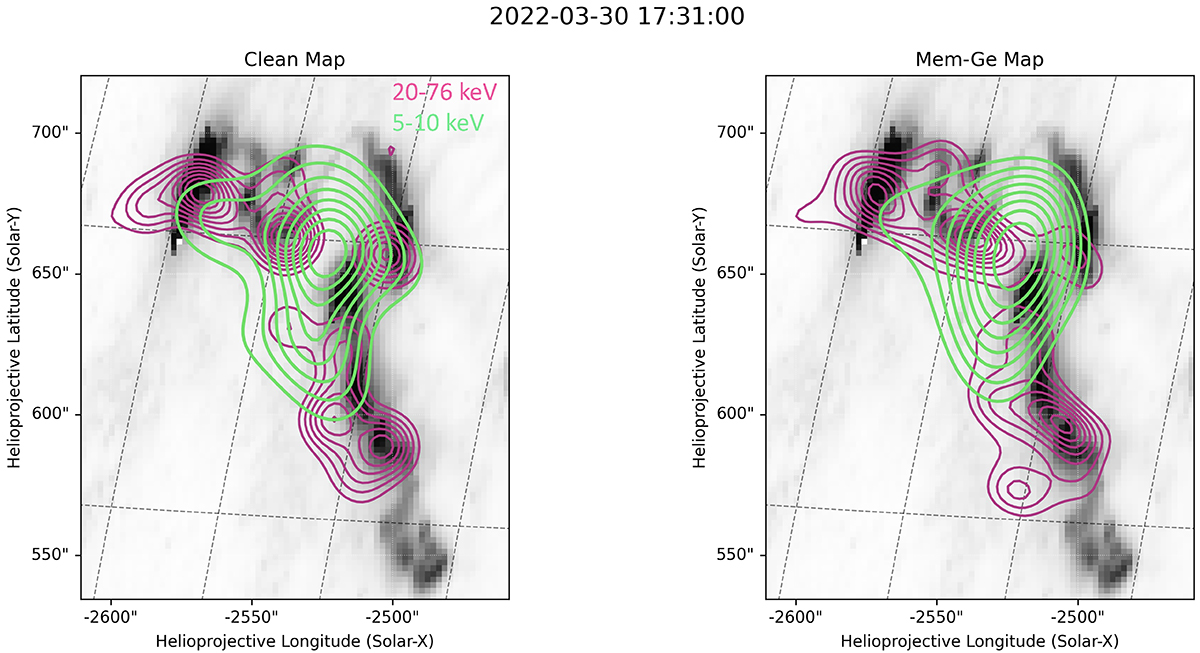
Fig. 4.
Download original image
HXR Clean and MEM_GE images for the peak centred at 17:31:00 overlaid on the AIA 1600 Å map at 17:31:02, in the Solar Orbiter reference frame. The pink contours at 20−90% represent the 20−76 keV STIX maps and the green 20−90% contours represent the 5−10 keV STIX maps. Both maps show HXR emission along the UV flare ribbons. The Clean algorithm produces more fractured HXR bright points compared to the more homogeneous emission obtained with MEM_GE. These multiple HXR sources correspond remarkably well to bright points observed along the UV ribbons.
Current usage metrics show cumulative count of Article Views (full-text article views including HTML views, PDF and ePub downloads, according to the available data) and Abstracts Views on Vision4Press platform.
Data correspond to usage on the plateform after 2015. The current usage metrics is available 48-96 hours after online publication and is updated daily on week days.
Initial download of the metrics may take a while.