Fig. 3.
Download original image
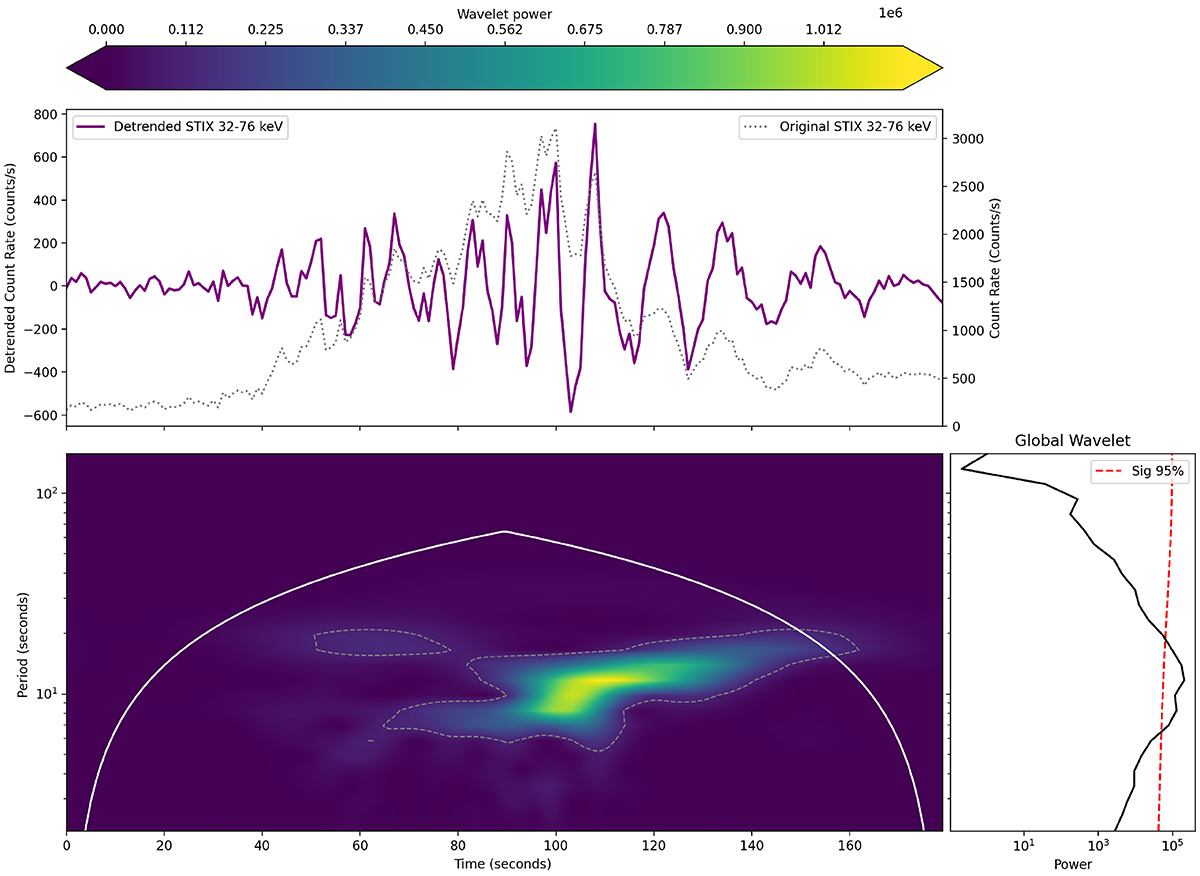
Wavelet power spectrum for the detrended light curve of the impulsive phase of HXR emission. The time range used is the same as in Fig. 2. The dotted grey curve in the top panel is the original light curve prior to detrending. The bottom panel shows the wavelet power spectrum, which has enhanced power above the 95% significance level (the dashed white curve) during the early impulsive phase. The global wavelet is also shown on the right-hand side. The enhanced power is at a period of ∼10 s, which agrees well with the 7 s period derived from the Gaussian decomposition method in Collier et al. (2023).
Current usage metrics show cumulative count of Article Views (full-text article views including HTML views, PDF and ePub downloads, according to the available data) and Abstracts Views on Vision4Press platform.
Data correspond to usage on the plateform after 2015. The current usage metrics is available 48-96 hours after online publication and is updated daily on week days.
Initial download of the metrics may take a while.