Fig. 2.
Download original image
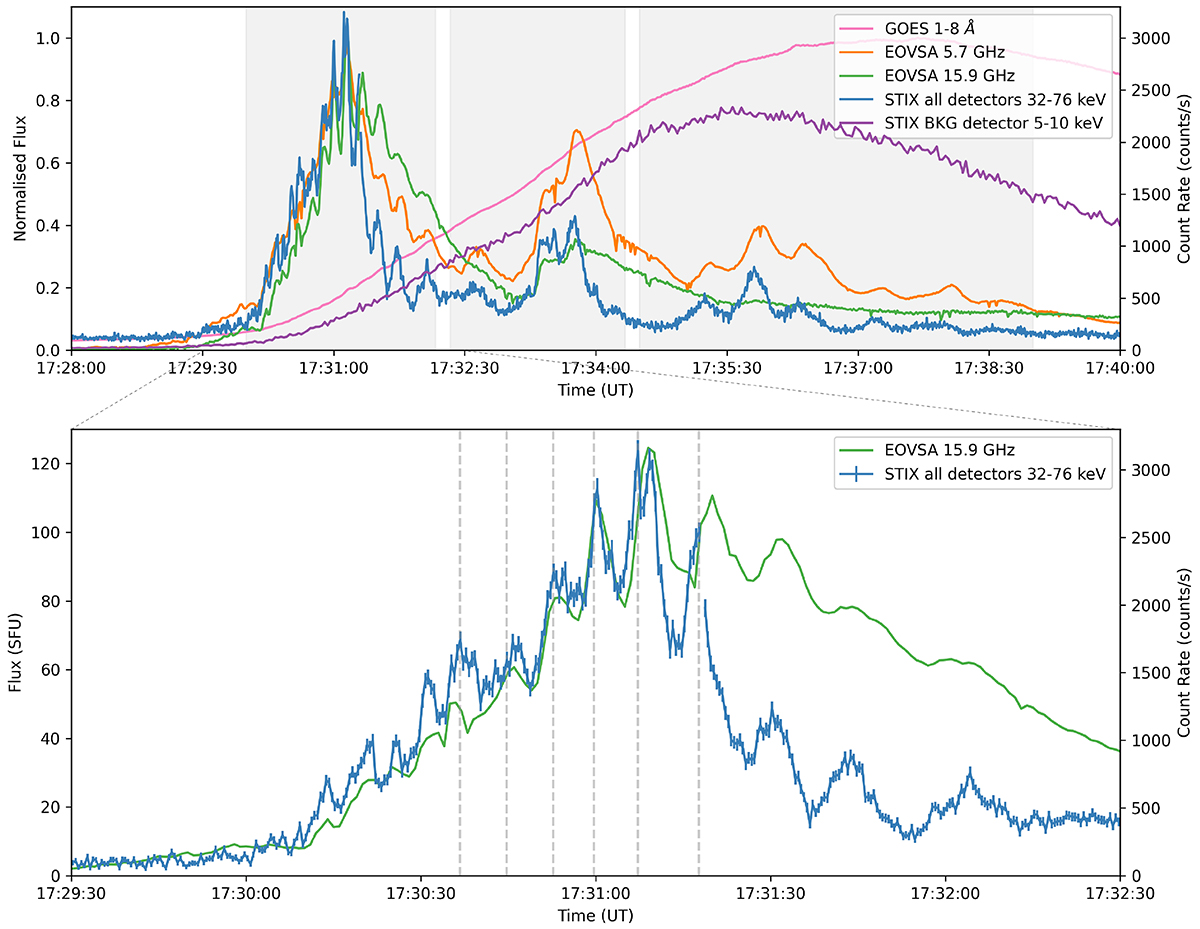
Overview plot of the event showing the time profiles from several instruments. The top panel shows the non-thermal and thermal evolution of the flare from STIX, EOVSA, and GOES/X-ray Sensor (XRS). The top panel shows the normalised GOES/XRS light curve alongside the normalised microwave emission observed with EOVSA in the 5.7 and 15.9 GHz channels. The STIX 32−76 keV time profile is shown, where the flux is summed over all detectors. The STIX 5−10 keV light curve is shown as observed by the background detector (BKG). The bottom panel shows a zoom onto the early impulsive phase of pulsations (phase 1) seen in HXR and microwave emission. The times shown are given at Earth in UT. The dashed lines correspond to the time at the centre of the integration bin used for reconstruction of the HXR images shown in Fig. 5; these correspond to the mean times of each component derived from the Gaussian decomposition method presented in Collier et al. (2023).
Current usage metrics show cumulative count of Article Views (full-text article views including HTML views, PDF and ePub downloads, according to the available data) and Abstracts Views on Vision4Press platform.
Data correspond to usage on the plateform after 2015. The current usage metrics is available 48-96 hours after online publication and is updated daily on week days.
Initial download of the metrics may take a while.