Fig. 9.
Download original image
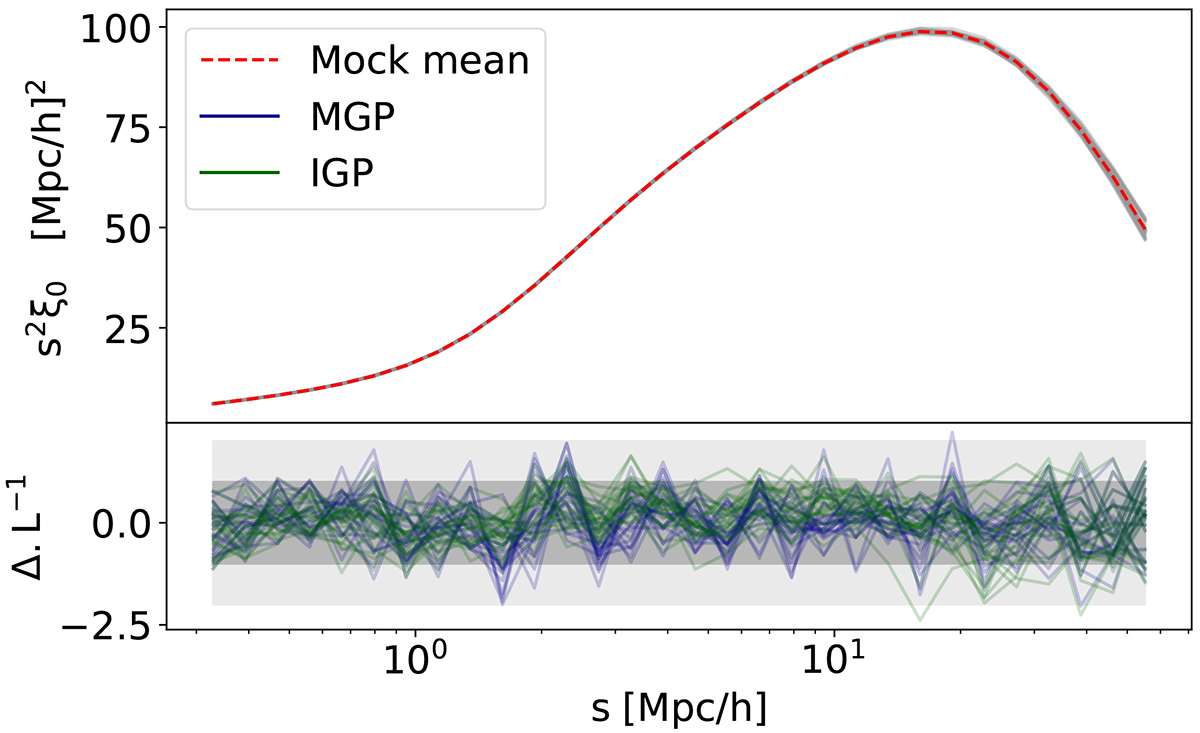
Emulator performance on mocks with different phase. In the upper panel the 25 realisations of Planck 2018 cosmology using the median HOD are shown in grey. The average is shown in red dotted line. The 25 residuals for both IGP (green) and MGP (blue) predictions are shown in the bottom panel. L−1 is the Cholesky decomposition of the inverse of Ctot. The grey shaded areas correspond to 1σ and 2σ deviations.
Current usage metrics show cumulative count of Article Views (full-text article views including HTML views, PDF and ePub downloads, according to the available data) and Abstracts Views on Vision4Press platform.
Data correspond to usage on the plateform after 2015. The current usage metrics is available 48-96 hours after online publication and is updated daily on week days.
Initial download of the metrics may take a while.