Fig. 7.
Download original image
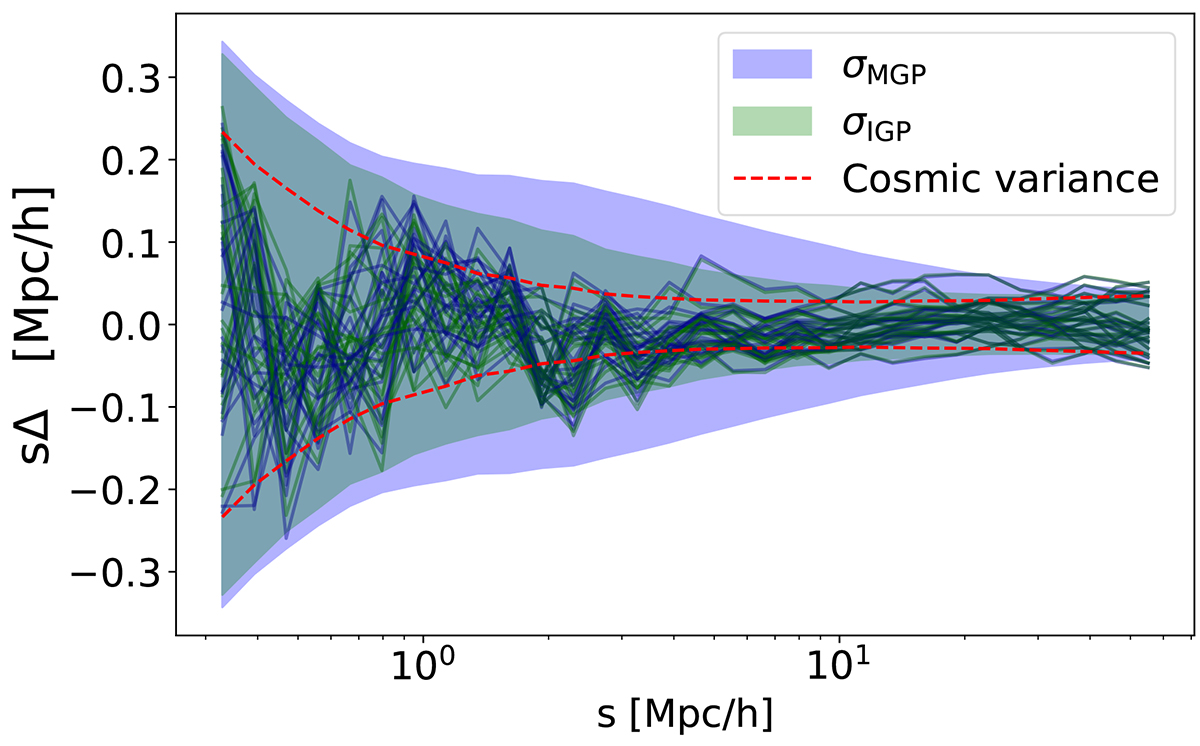
Difference between the emulators prediction and the 25 realisations of Planck 2018 cosmology with the median HOD in blue and green lines for the MGP and IGP, respectively. The red dashed line describes the cosmic variance level. The total variances, including the emulator variance predictions, are shown with the blue and green shaded area.
Current usage metrics show cumulative count of Article Views (full-text article views including HTML views, PDF and ePub downloads, according to the available data) and Abstracts Views on Vision4Press platform.
Data correspond to usage on the plateform after 2015. The current usage metrics is available 48-96 hours after online publication and is updated daily on week days.
Initial download of the metrics may take a while.