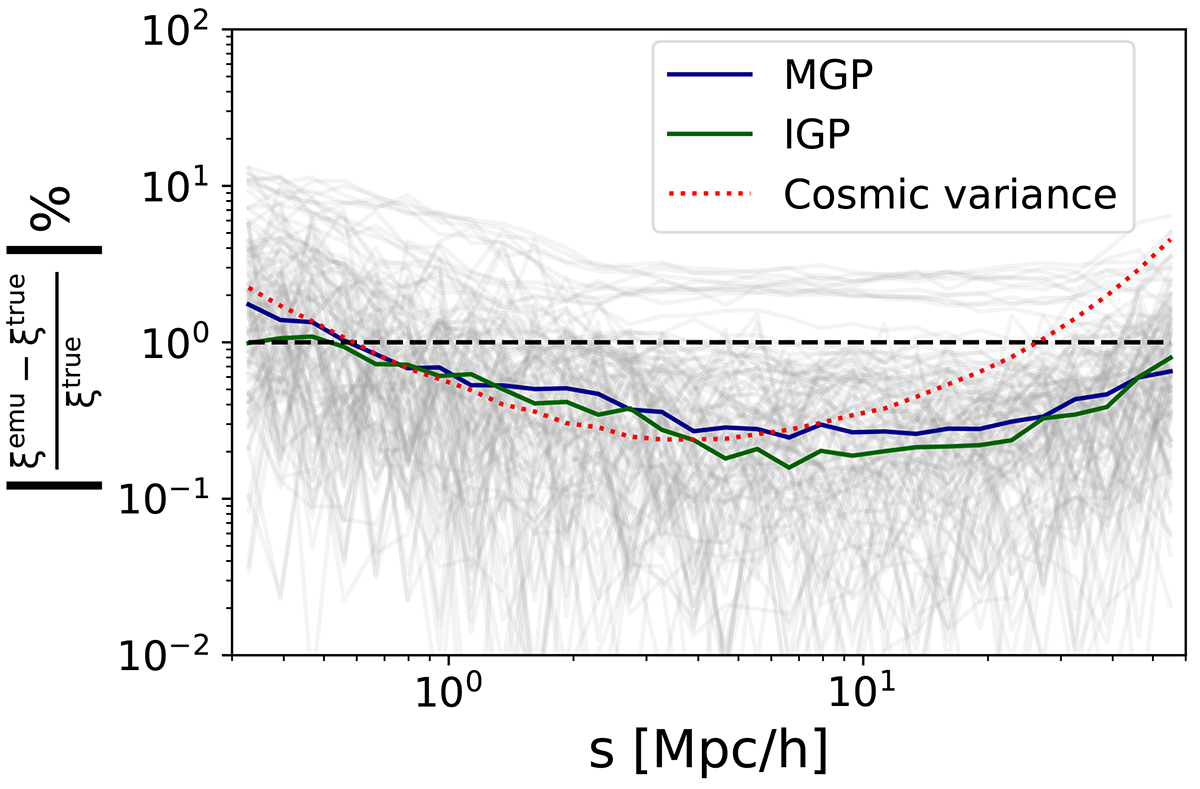
Fig. 6.
Download original image
Grey lines show the relative difference between the MGP emulator prediction and the expected values for the full test set, as a percentage difference. The blue and green lines are the median of those deviations for the MGP and IGP models, respectively. The black dotted line corresponds to a 1% deviation. The red dotted line shows the median of |σ/ξtrue| as a percentage. Here, σ2 is the cosmic variance computed for the Planck 2018 cosmology and median HOD.
Current usage metrics show cumulative count of Article Views (full-text article views including HTML views, PDF and ePub downloads, according to the available data) and Abstracts Views on Vision4Press platform.
Data correspond to usage on the plateform after 2015. The current usage metrics is available 48-96 hours after online publication and is updated daily on week days.
Initial download of the metrics may take a while.