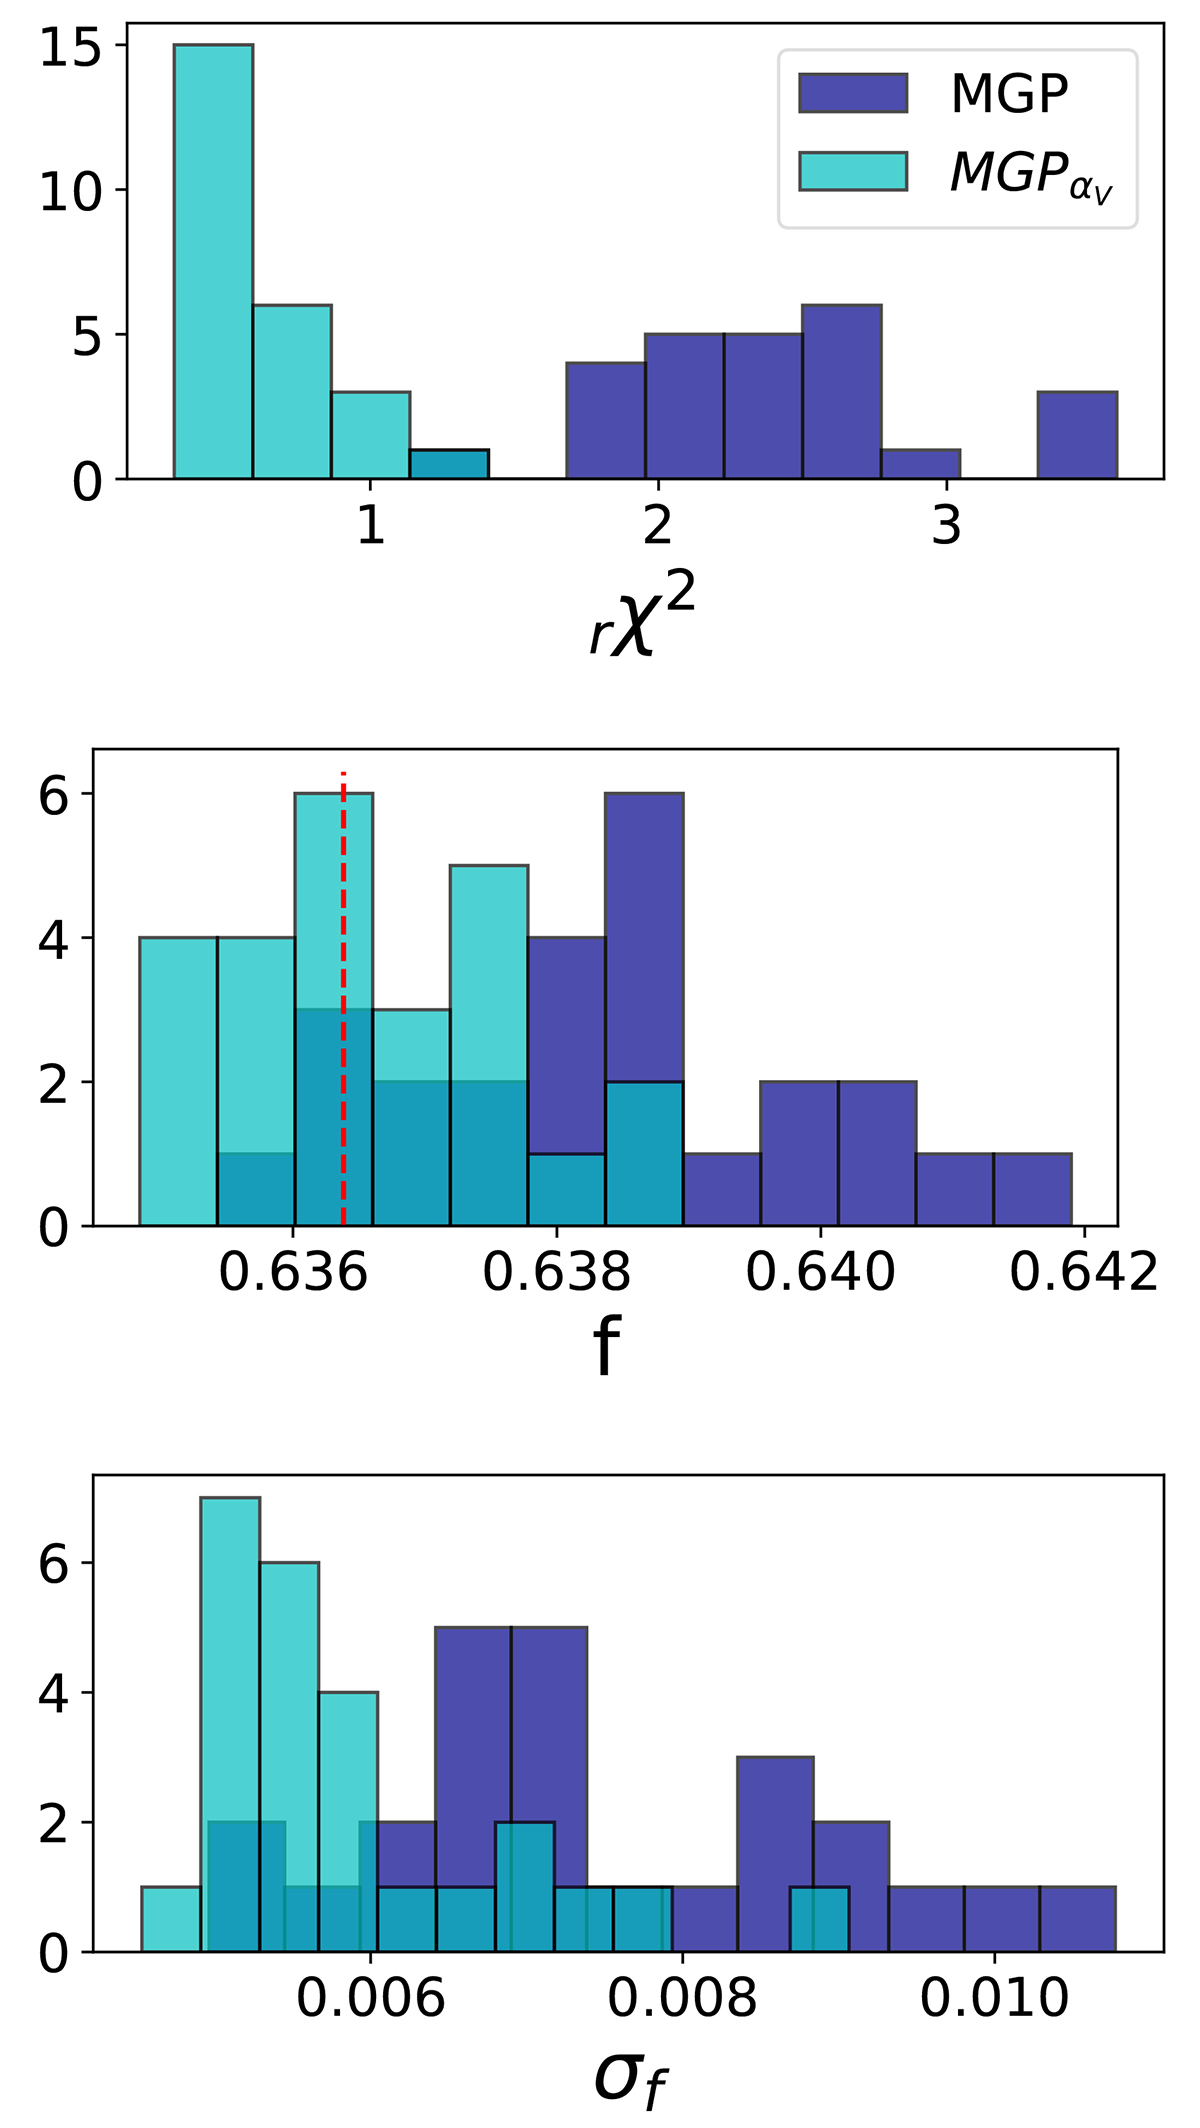
Fig. 16.
Download original image
Reduced chi squared, best-fit growth rate, and corresponding uncertainties resulting from the separate fits of the 25 mocks with spherical full-sky footprint from z = 0.15 to z = 0.25, AP distortion, Planck 2018 cosmology, and the median HOD. Results using the MGP with and without modelling AP distortions are shown in cyan and blue, respectively. The true growth-rate value is shown by a red dotted line.
Current usage metrics show cumulative count of Article Views (full-text article views including HTML views, PDF and ePub downloads, according to the available data) and Abstracts Views on Vision4Press platform.
Data correspond to usage on the plateform after 2015. The current usage metrics is available 48-96 hours after online publication and is updated daily on week days.
Initial download of the metrics may take a while.