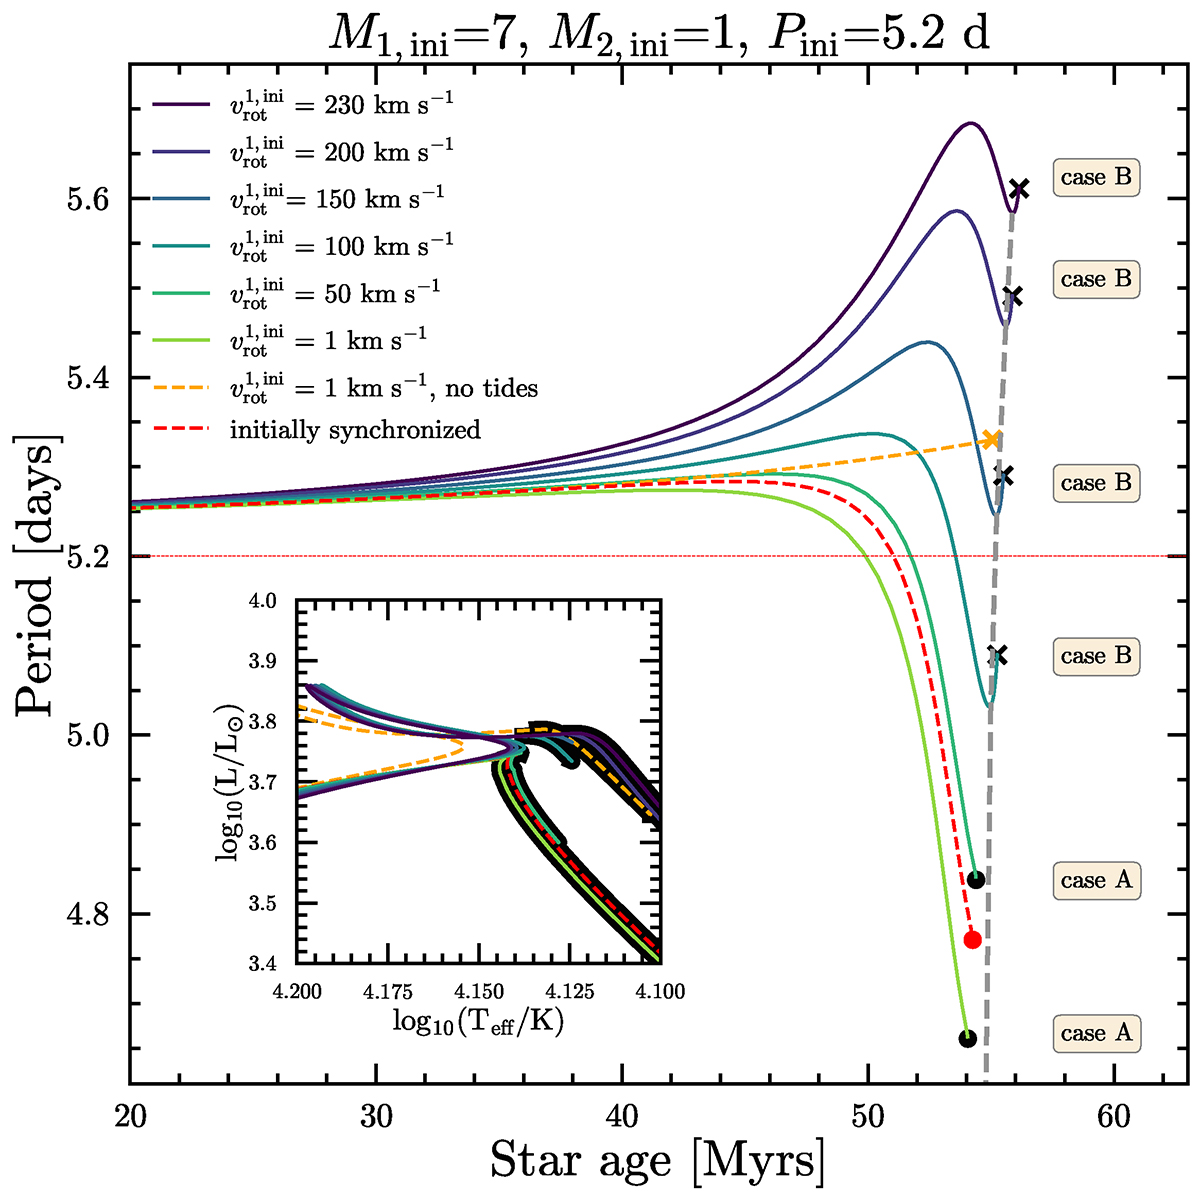
Fig. 5.
Download original image
Evolution of the orbital period of HD 25631 for different values of the initial rotational velocity (including initially synchronized rotation for a given Pini). The tracks stop at the onset of Roche lobe overflow of the primary star. When this occurs during its main-sequence (case A) we mark it by dots, conversely, if this happens after TAMS (gray dashed line) in a case B, we mark it with crosses. For reference, the inset shows the HR diagram around TAMS, where the beginning of the RLOF phases are marked by thick black outlines. The red horizontal line visualizes the initial value of the orbital period. In these simulations we used the sync_type = “Hut_rad” tidal prescription.
Current usage metrics show cumulative count of Article Views (full-text article views including HTML views, PDF and ePub downloads, according to the available data) and Abstracts Views on Vision4Press platform.
Data correspond to usage on the plateform after 2015. The current usage metrics is available 48-96 hours after online publication and is updated daily on week days.
Initial download of the metrics may take a while.