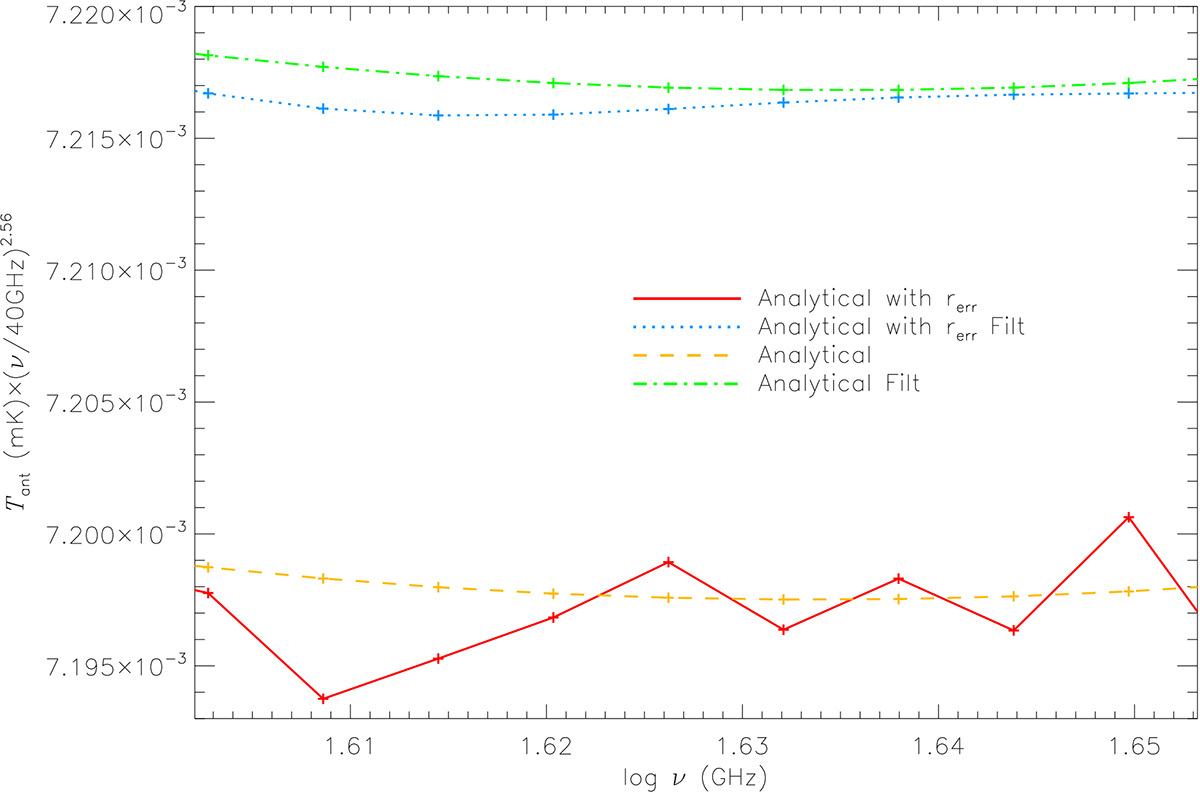
Fig. 5.
Download original image
Comparison between the original signals represented by the polynomial interpolations in log–log of the ESMB without any error or adding relative errors and the corresponding filtered ones. We display the signal according to the original tabulation which is equally spaced in log ν, and multiply the antenna temperature by a certain power of the frequency to better visualise small-scale effects due to the added noise superimposed to the general trend. We consider a narrow frequency interval corresponding to nine grid points, as in those adopted in the differential scheme to numerically compute subsequent derivatives (Sect. 5). See legend and text.
Current usage metrics show cumulative count of Article Views (full-text article views including HTML views, PDF and ePub downloads, according to the available data) and Abstracts Views on Vision4Press platform.
Data correspond to usage on the plateform after 2015. The current usage metrics is available 48-96 hours after online publication and is updated daily on week days.
Initial download of the metrics may take a while.