Fig. 4.
Download original image
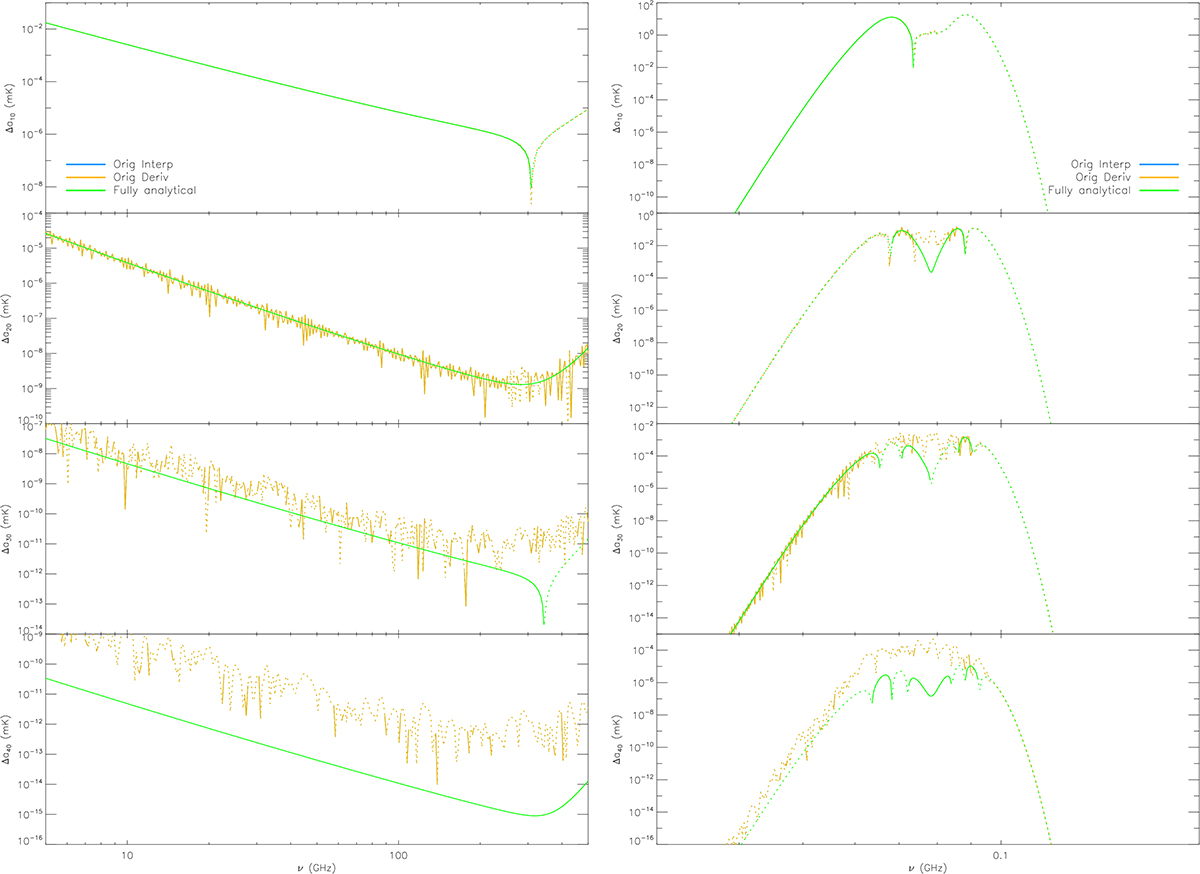
Comparison between the interpolation and the derivative schemes with the ideal fully analytical treatment applied to the analytical representations of the ESMB (left column) and the 21 cm EDGES profile (right column) considering ![]() and
and ![]() , respectively, without including the prefiltering and up to multipole 4. Here (and in the following analogous figures), solid (dots) lines refer to positive (negative) values. See legend for an explanation of the symbols and lines.
, respectively, without including the prefiltering and up to multipole 4. Here (and in the following analogous figures), solid (dots) lines refer to positive (negative) values. See legend for an explanation of the symbols and lines.
Current usage metrics show cumulative count of Article Views (full-text article views including HTML views, PDF and ePub downloads, according to the available data) and Abstracts Views on Vision4Press platform.
Data correspond to usage on the plateform after 2015. The current usage metrics is available 48-96 hours after online publication and is updated daily on week days.
Initial download of the metrics may take a while.