Fig. E.1.
Download original image
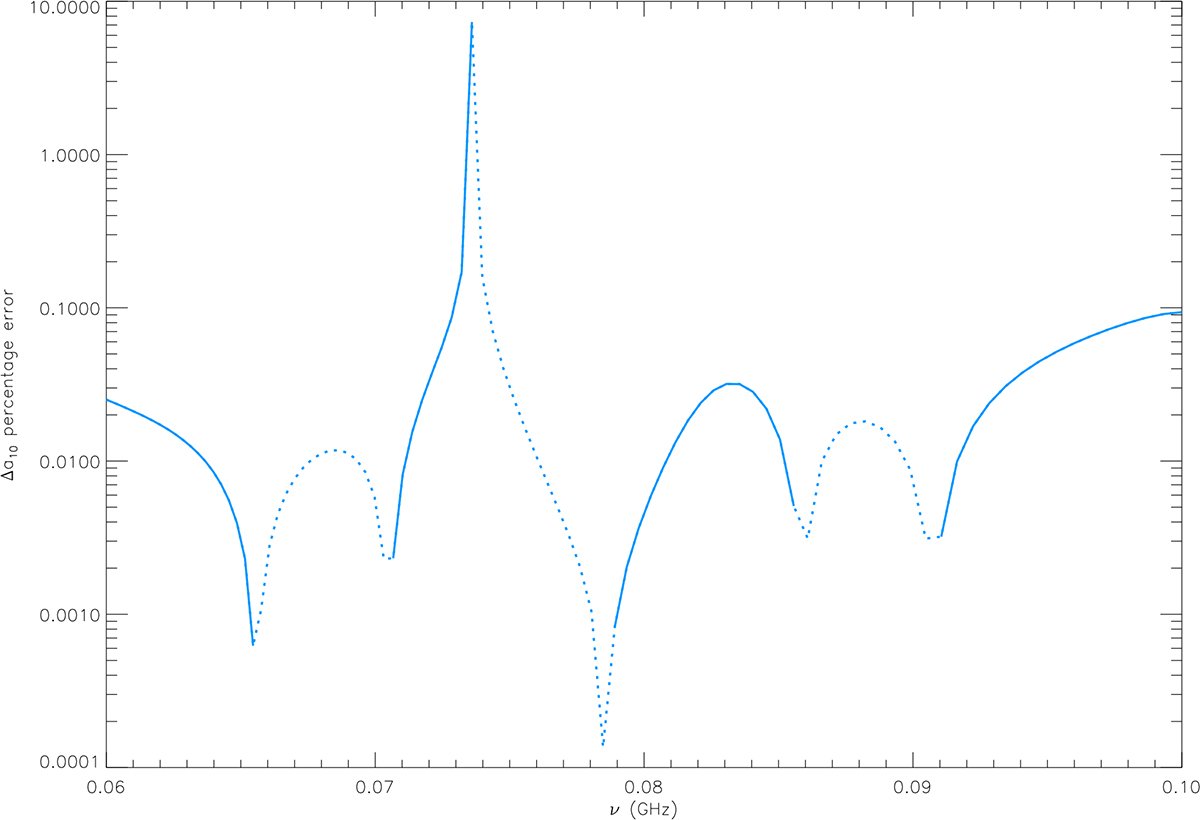
Percentage difference between Δa1, 0 computed for the analytical description of the EDGES absorption profile using Eq. (10) with all the terms and taking only the contribution from the first-order derivative, in the ideal case without errors. We note that the expected divergence at a frequency of around ≃73.5 MHz disappears only due to frequency sampling. Solid (dots) lines refer to positive (negative) values. See text.
Current usage metrics show cumulative count of Article Views (full-text article views including HTML views, PDF and ePub downloads, according to the available data) and Abstracts Views on Vision4Press platform.
Data correspond to usage on the plateform after 2015. The current usage metrics is available 48-96 hours after online publication and is updated daily on week days.
Initial download of the metrics may take a while.