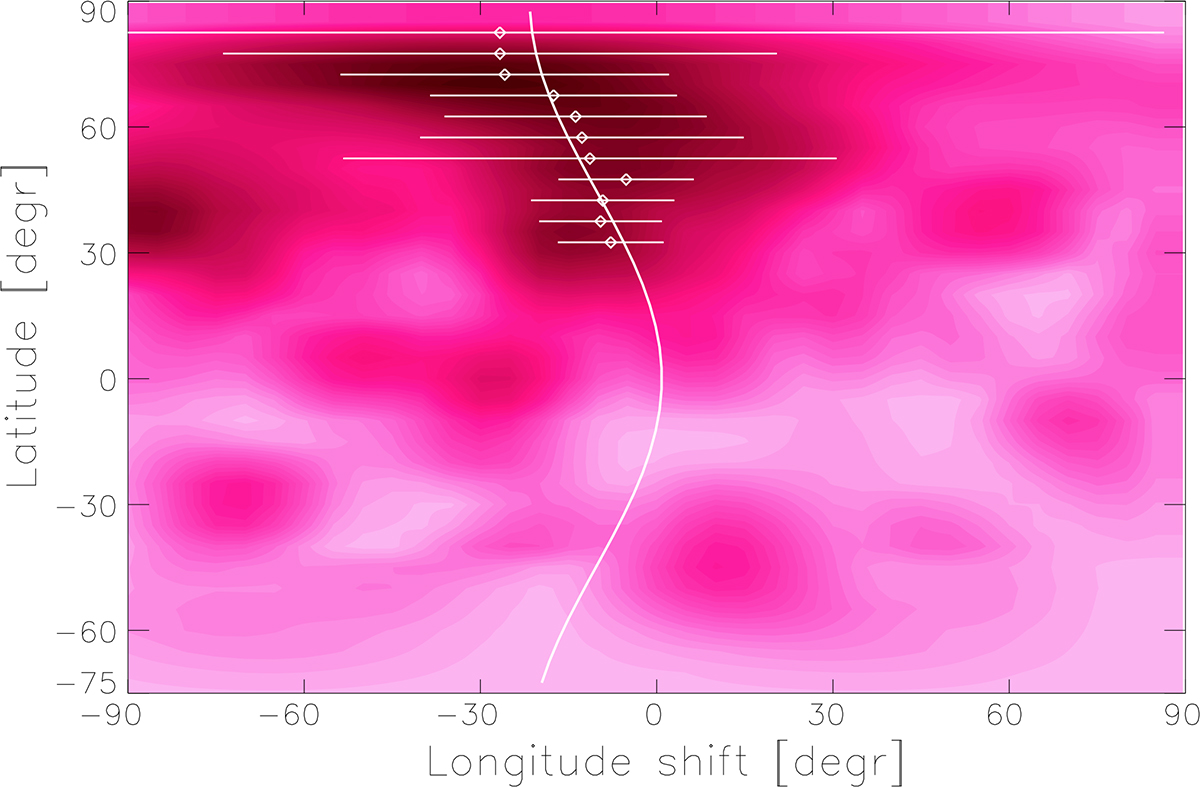
Fig. 9.
Download original image
Average cross-correlation function map derived from 18 individual cross correlations. The stronger the correlation, the darker the shade. The map indicates how much longitude shift occurs at a given latitude due to surface shear during ∼6 Prot (which is the average time difference between the mean-HJDs of the consecutive maps; see Table 4).
Current usage metrics show cumulative count of Article Views (full-text article views including HTML views, PDF and ePub downloads, according to the available data) and Abstracts Views on Vision4Press platform.
Data correspond to usage on the plateform after 2015. The current usage metrics is available 48-96 hours after online publication and is updated daily on week days.
Initial download of the metrics may take a while.