Fig. 4.
Download original image
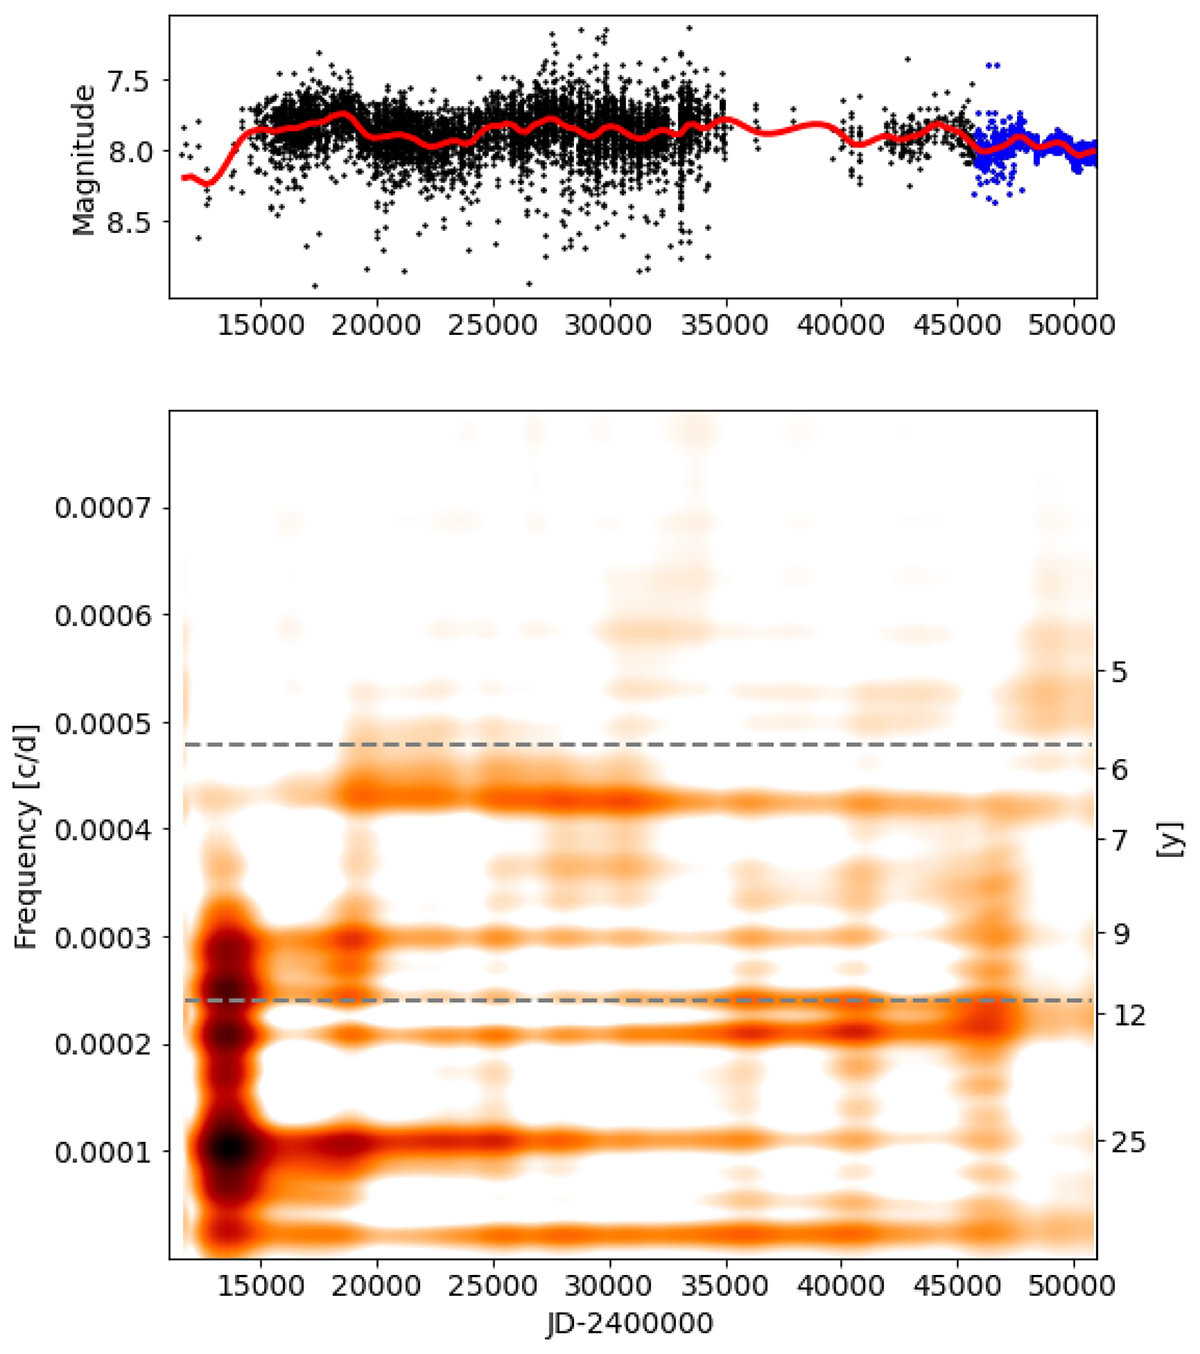
Long-term photometry and time-frequency analysis of V815 Her. Top: DASCH light curve of ≈100 yr for V815 Her from scanned photographic plates (black dots) supplemented with photoelectric data (blue dots) spanning more than a century between 1890–1998 with 5 yr’ overlap. The spline smoothed data are indicated by a red line. Bottom: time-frequency analysis for the available photographic+photoelectric data of V815 Her using the TiFrAn code (Kolláth & Oláh 2009). The plot indicates dominant cycles of different lengths and amplitudes on timescales corresponding to ∼6.5, ∼9.1, ∼11.5, ∼13 and ∼26 yr, the latter two are probably multiples of the 6.5-yr period. Dashed lines indicate the 2092 d period of the wide orbit and its double at 4184 d (≈11.5 yr). See the text for more.
Current usage metrics show cumulative count of Article Views (full-text article views including HTML views, PDF and ePub downloads, according to the available data) and Abstracts Views on Vision4Press platform.
Data correspond to usage on the plateform after 2015. The current usage metrics is available 48-96 hours after online publication and is updated daily on week days.
Initial download of the metrics may take a while.