Fig. 3.
Download original image
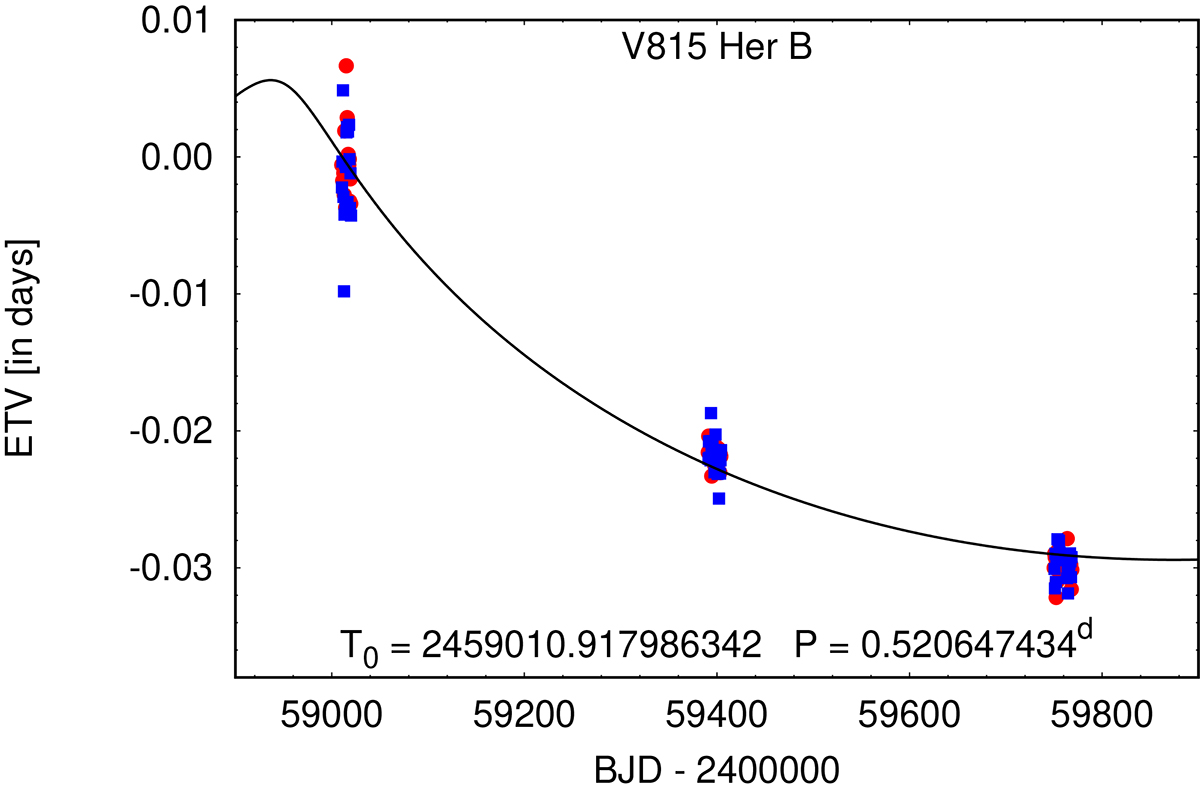
Eclipse timing variations of V815 Her B calculated from the mid-minima times of primary and secondary eclipses based on TESS observations. The red dots and blue squares represent the primary and secondary eclipses, respectively. The black line represents the theoretical LTTE curve derived from the former third-body RV solution of Fekel et al. (2005). See text for details.
Current usage metrics show cumulative count of Article Views (full-text article views including HTML views, PDF and ePub downloads, according to the available data) and Abstracts Views on Vision4Press platform.
Data correspond to usage on the plateform after 2015. The current usage metrics is available 48-96 hours after online publication and is updated daily on week days.
Initial download of the metrics may take a while.