Open Access
Fig. E.1.
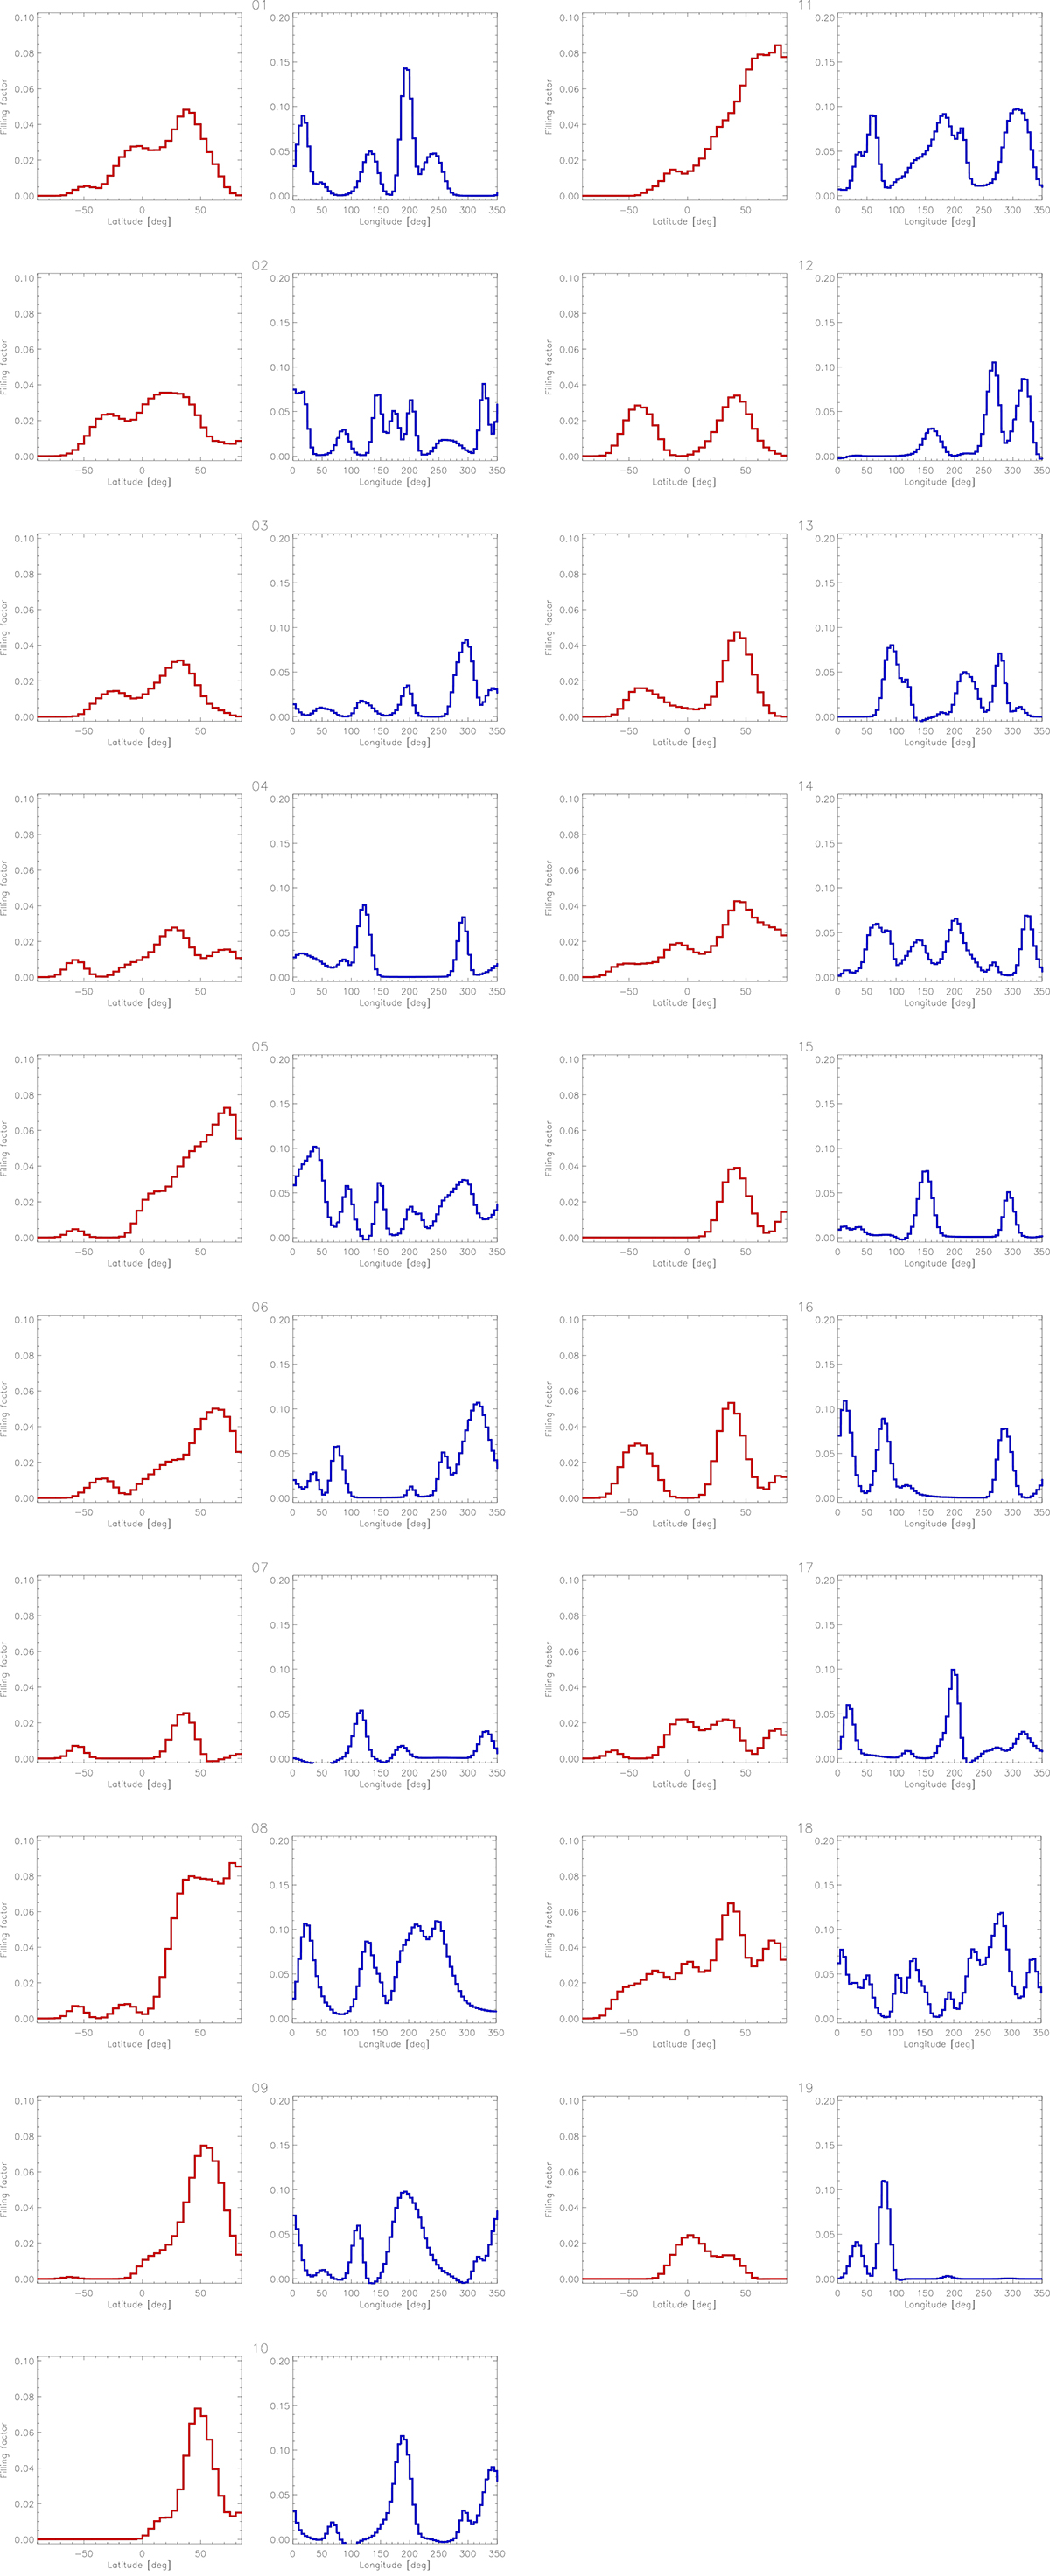
Download original image
The spot filling factors for the nineteen Doppler images in the arrangement corresponding to Fig. D.1. For each temperature map, the histogram of the spot filling factor is shown in two panels: on the left side (in red), summed along the latitude, and on the right side (in blue), summed up along the longitude.
Current usage metrics show cumulative count of Article Views (full-text article views including HTML views, PDF and ePub downloads, according to the available data) and Abstracts Views on Vision4Press platform.
Data correspond to usage on the plateform after 2015. The current usage metrics is available 48-96 hours after online publication and is updated daily on week days.
Initial download of the metrics may take a while.