Open Access
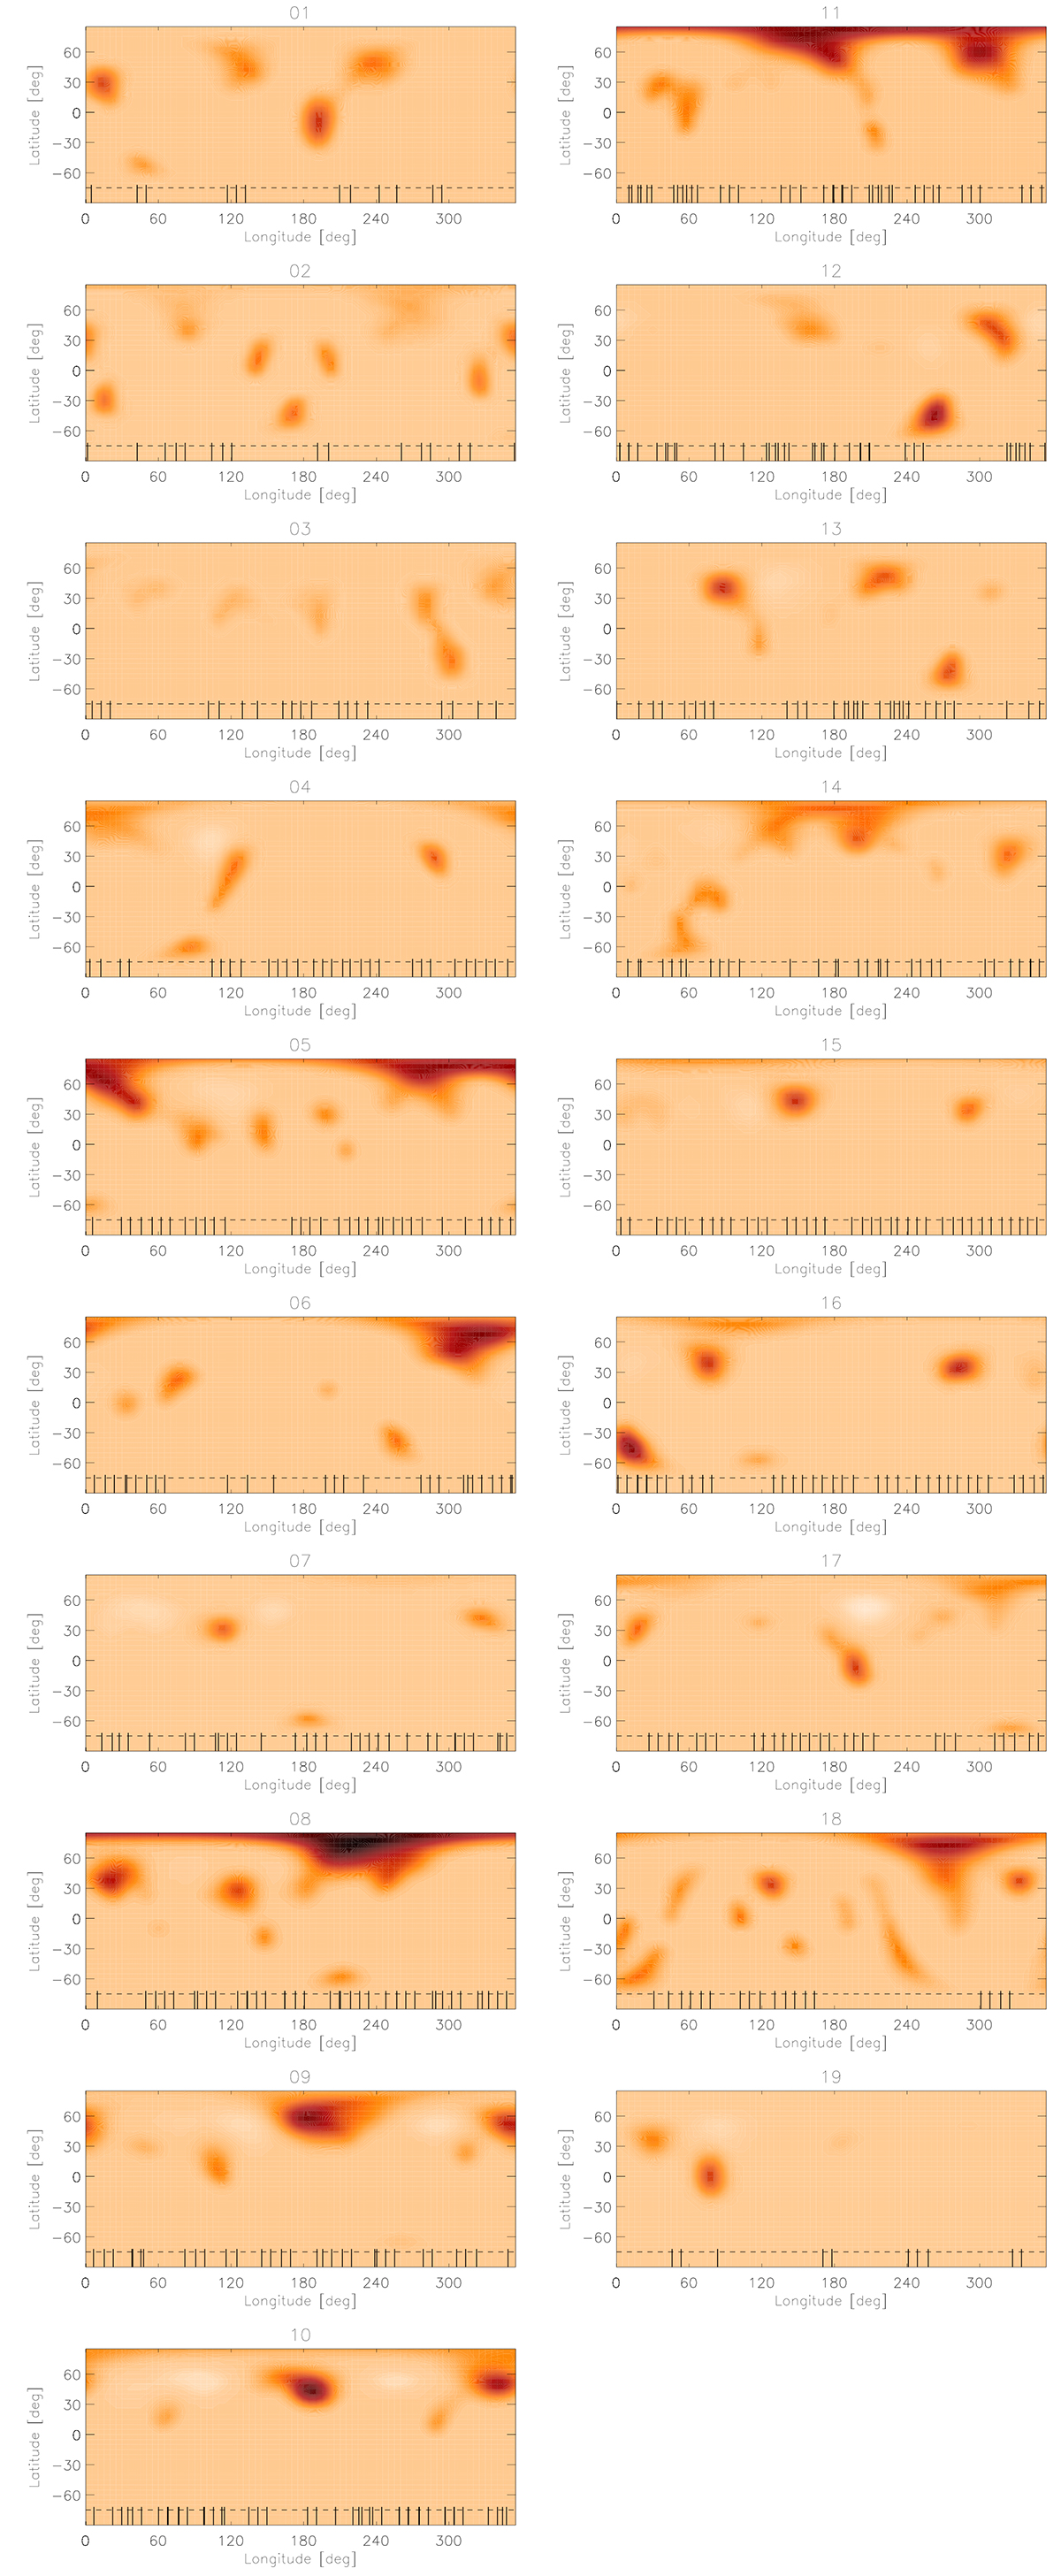
Fig. D.1.
Download original image
Doppler images S01-S10 (left, top to bottom) and S11-S19 (right, top to bottom) plotted in Mercator projection. The maps and the temperature scale correspond to those shown in Fig. 8. The ticks on the bottom edge indicate the phases of the observations used for that map.
Current usage metrics show cumulative count of Article Views (full-text article views including HTML views, PDF and ePub downloads, according to the available data) and Abstracts Views on Vision4Press platform.
Data correspond to usage on the plateform after 2015. The current usage metrics is available 48-96 hours after online publication and is updated daily on week days.
Initial download of the metrics may take a while.