Open Access
Fig. C.2.
Download original image
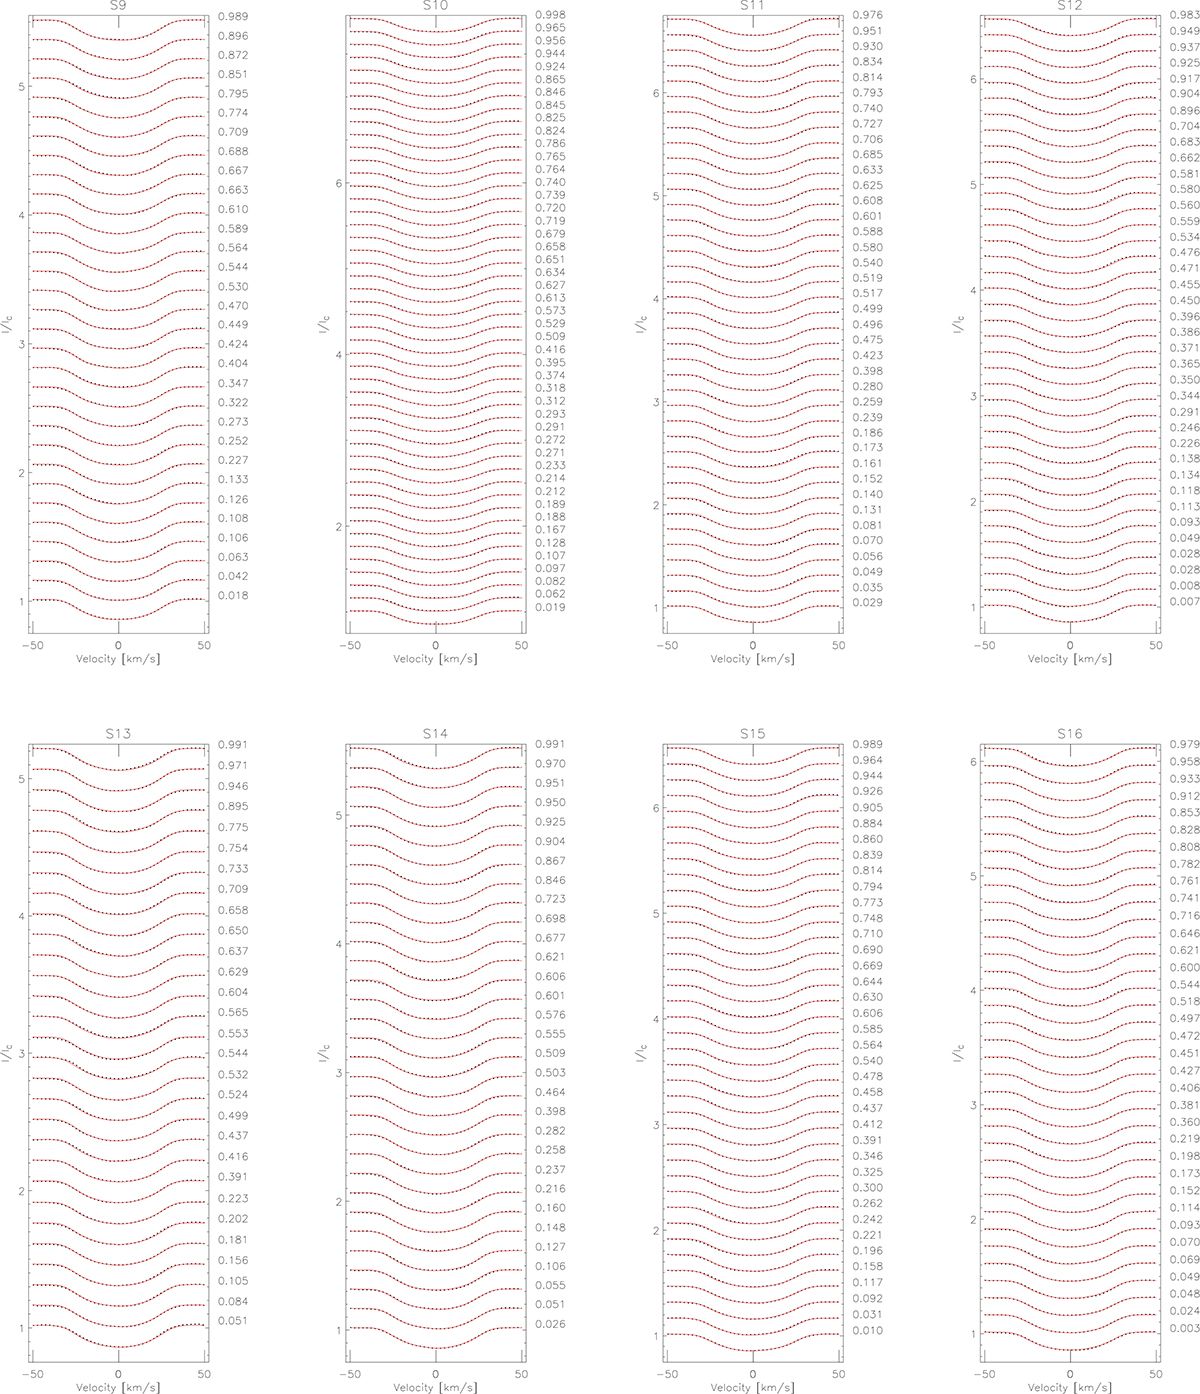
Fitted line profile subsets corresponding to the Doppler images S09-S16 presented in Fig. 8. The phase values of each profile are shown on the right side of the panels.
Current usage metrics show cumulative count of Article Views (full-text article views including HTML views, PDF and ePub downloads, according to the available data) and Abstracts Views on Vision4Press platform.
Data correspond to usage on the plateform after 2015. The current usage metrics is available 48-96 hours after online publication and is updated daily on week days.
Initial download of the metrics may take a while.