Fig. 7.
Download original image
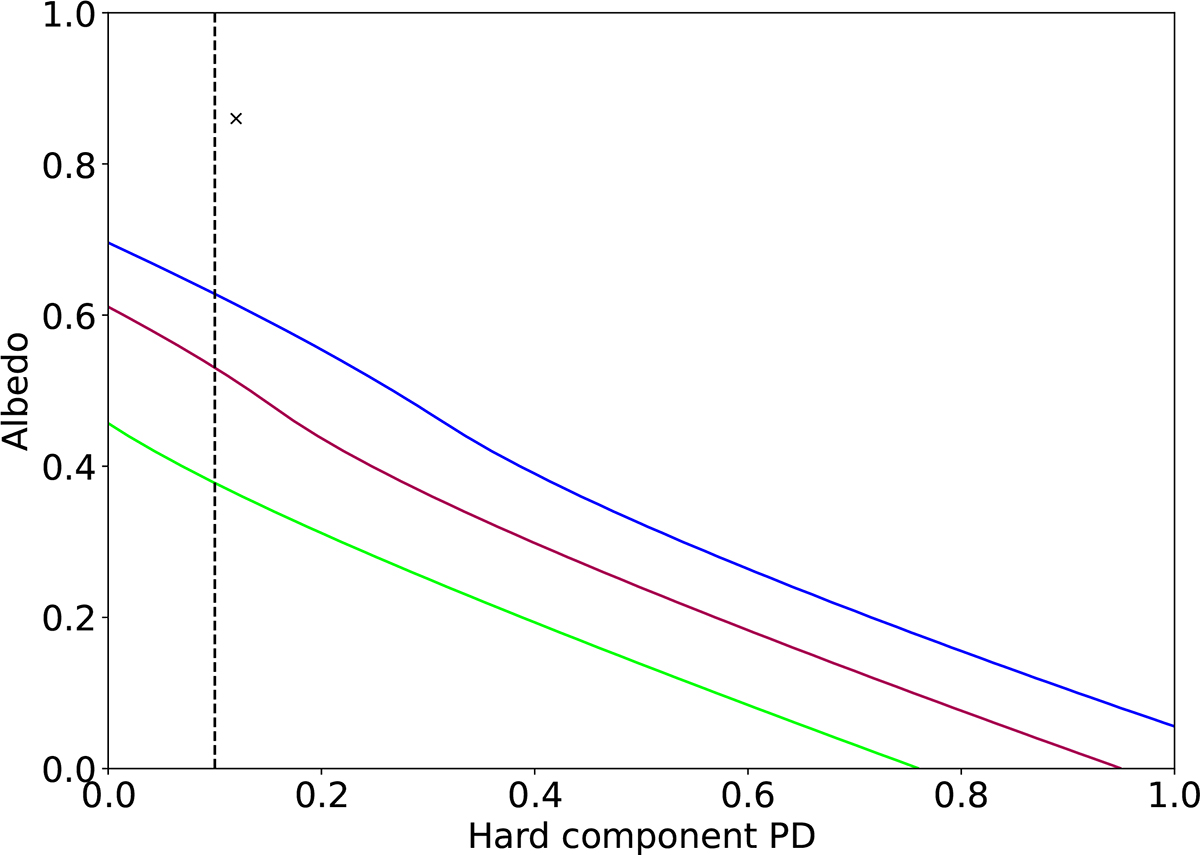
Contour plot of the corona emission PD and the kynbbrr albedo parameter, which regulates the returning radiation contribution. Blue, red, and green lines indicate 68%, 90%, and 99% confidence levels for two parameters of interest, respectively, while the black cross indicates the best-fitting parameters. The dotted vertical line represents the assumed upper limit on the corona emission PD, as described in Sect. 3.3.
Current usage metrics show cumulative count of Article Views (full-text article views including HTML views, PDF and ePub downloads, according to the available data) and Abstracts Views on Vision4Press platform.
Data correspond to usage on the plateform after 2015. The current usage metrics is available 48-96 hours after online publication and is updated daily on week days.
Initial download of the metrics may take a while.