Fig. 6.
Download original image
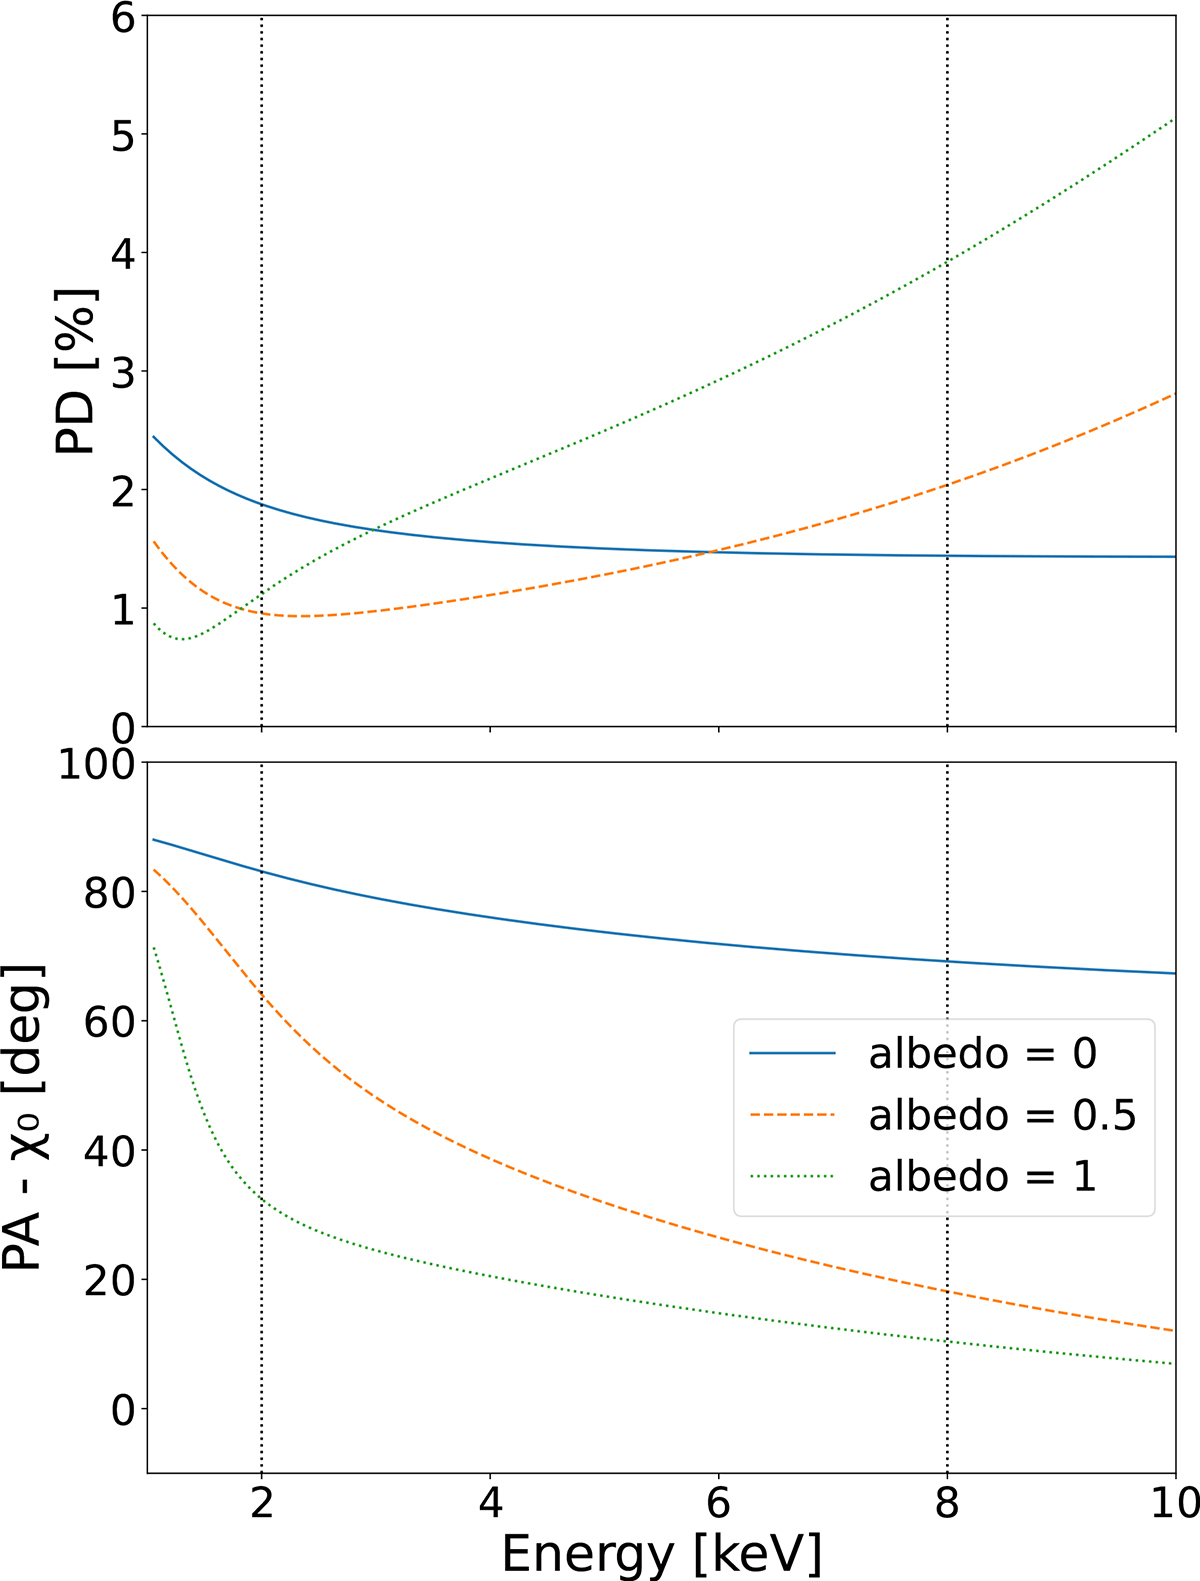
PD (top) and PA (bottom) predicted by the kynbbrr model for the disc emission, assuming all system parameters are fixed at their respective best-fitting values (see Table 1). The different colours indicate different contributions of the returning radiation component, regulated by the albedo parameter. The vertical dashed lines highlight the 2–8 keV energy range. Here, the PA is defined with respect to the disc axis position angle χ0.
Current usage metrics show cumulative count of Article Views (full-text article views including HTML views, PDF and ePub downloads, according to the available data) and Abstracts Views on Vision4Press platform.
Data correspond to usage on the plateform after 2015. The current usage metrics is available 48-96 hours after online publication and is updated daily on week days.
Initial download of the metrics may take a while.