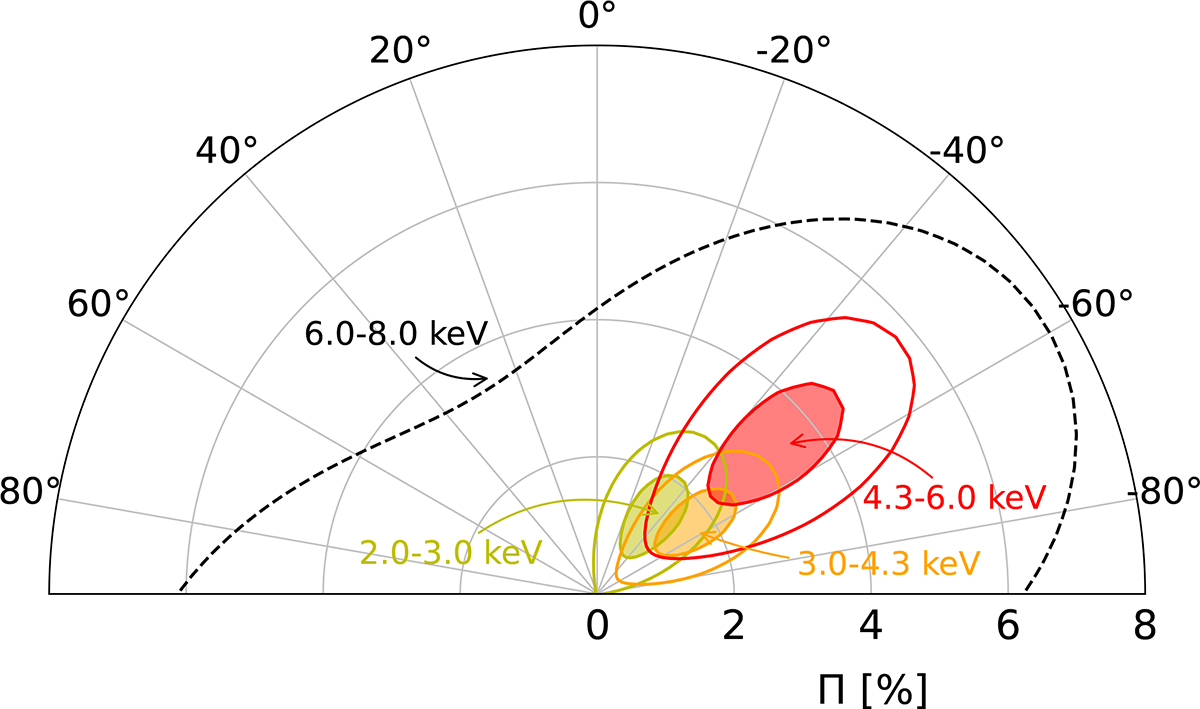
Fig. 5.
Download original image
Polar plot of the PD and PA, assuming the spectral best-fit model, in four energy bins: 2.0–3.0, 3.0–4.3, 4.3–6.0, and 6.0–8.0 keV. The shaded and unshaded regions show the 68% and 99.9% confidence areas, respectively, in the first three energy bins. The dashed line indicates the 99.9% confidence level upper limit in the fourth energy bin.
Current usage metrics show cumulative count of Article Views (full-text article views including HTML views, PDF and ePub downloads, according to the available data) and Abstracts Views on Vision4Press platform.
Data correspond to usage on the plateform after 2015. The current usage metrics is available 48-96 hours after online publication and is updated daily on week days.
Initial download of the metrics may take a while.