Fig. 3.
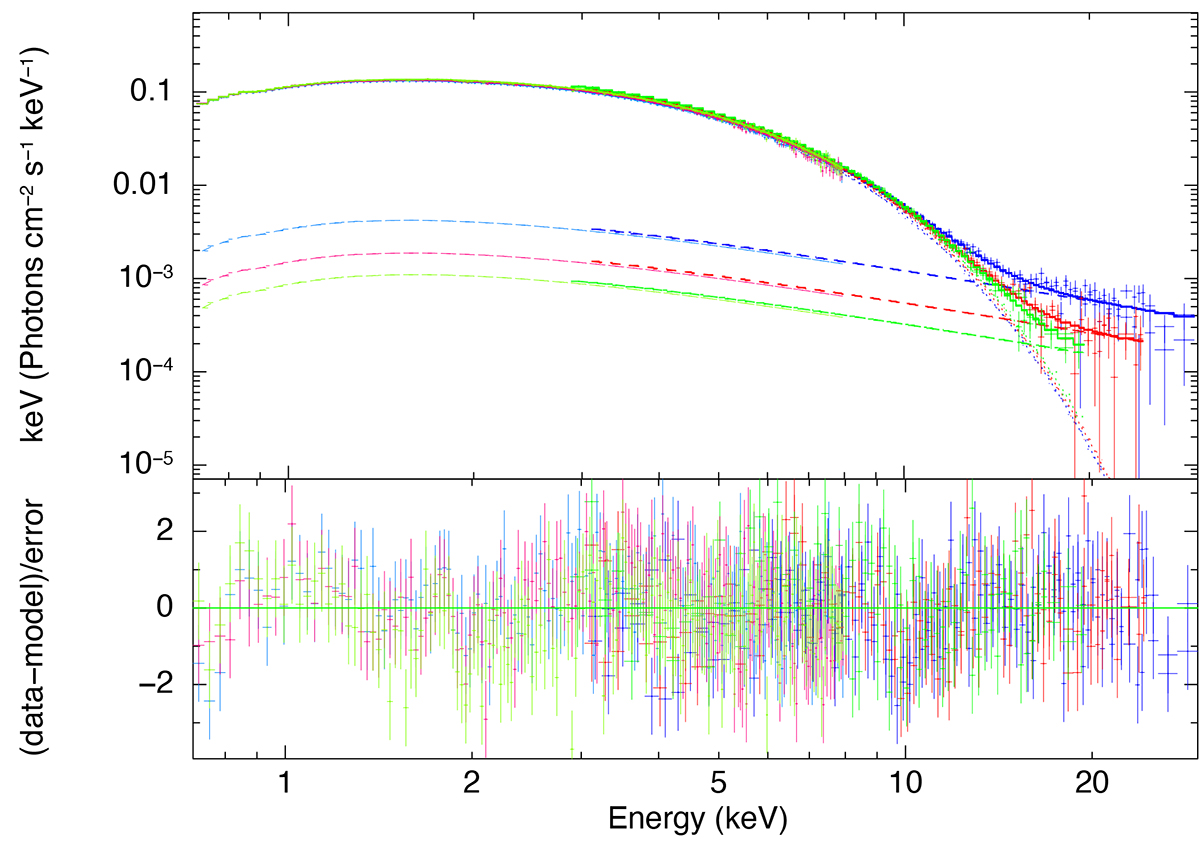
Download original image
NICER and NuSTAR spectra of 4U 1957+115. Top panel: unfolded spectra (i.e. the flux F(E)) for the best-fitting model described by Model 1 during Periods 1, 2, and 3, shown in red, blue, and green, respectively. The total model for each period, the contributions of the kerrbb and the powerlaw models are shown with the solid, dotted and dashed lines, respectively. Bottom panel: model minus data residuals in units of σ.
Current usage metrics show cumulative count of Article Views (full-text article views including HTML views, PDF and ePub downloads, according to the available data) and Abstracts Views on Vision4Press platform.
Data correspond to usage on the plateform after 2015. The current usage metrics is available 48-96 hours after online publication and is updated daily on week days.
Initial download of the metrics may take a while.