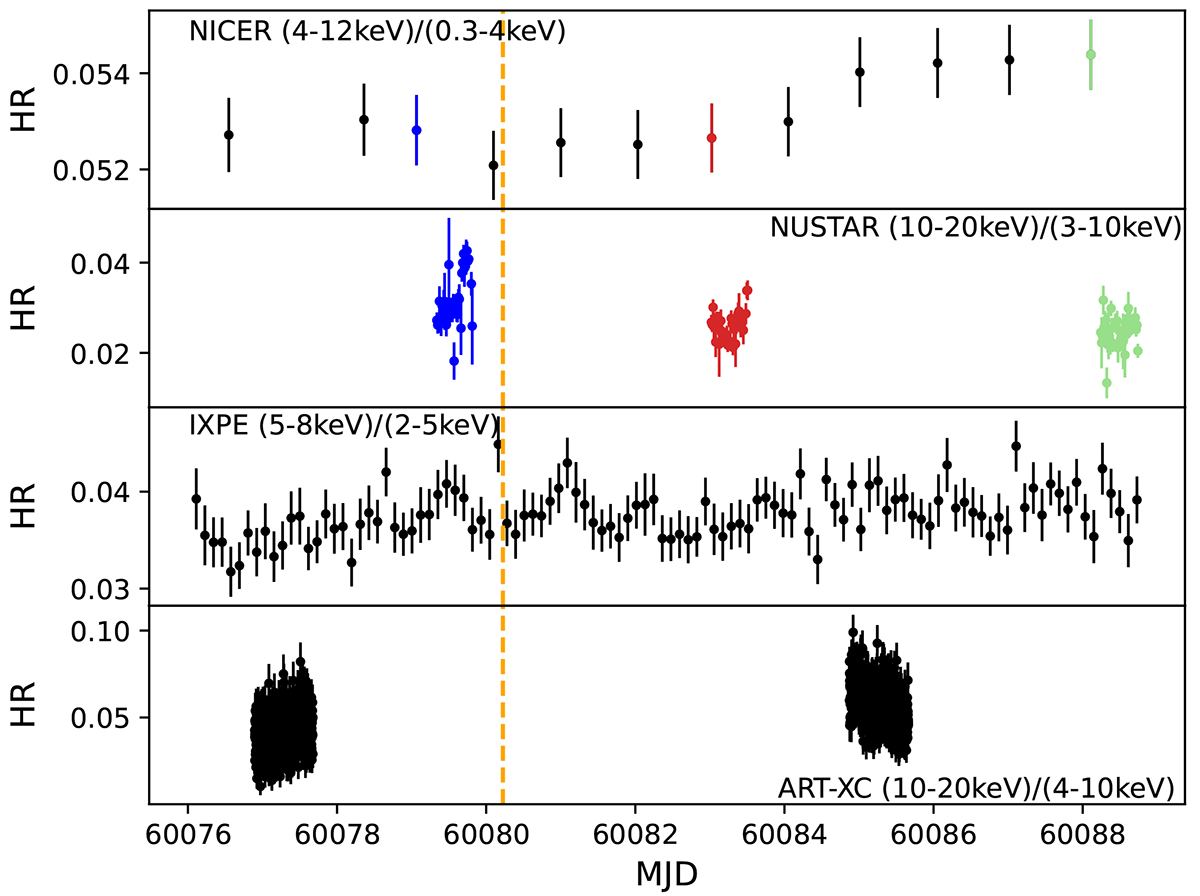
Fig. 2.
Download original image
Time evolution of the hardness ratio from NICER, NuSTAR, IXPE, and ART-XC data as defined in the text. NuSTAR and NICER data coloured in blue, red, and green refer to the three epochs described in the spectral analysis and used in the spectra shown in Fig. 3. The vertical orange line shows the subdivision of the IXPE observation described in Sect. 3.2.
Current usage metrics show cumulative count of Article Views (full-text article views including HTML views, PDF and ePub downloads, according to the available data) and Abstracts Views on Vision4Press platform.
Data correspond to usage on the plateform after 2015. The current usage metrics is available 48-96 hours after online publication and is updated daily on week days.
Initial download of the metrics may take a while.