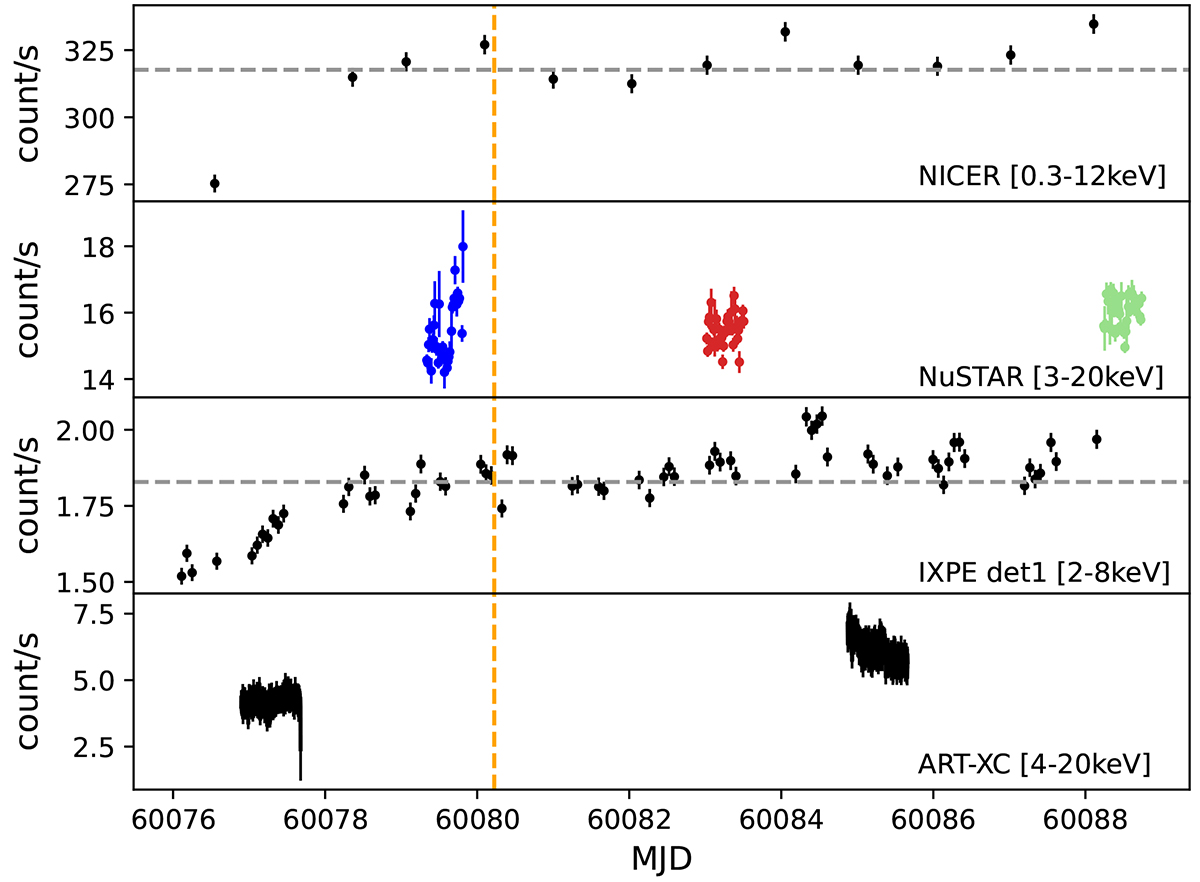
Fig. 1.
Download original image
Light curves of 4U 1957+115 as seen by NICER in the 0.3–12 keV energy band, NuSTAR in 3–20 keV, IXPE in 2–8 keV, and ART-XC in 4–12 keV. NuSTAR data coloured in blue, red, and green refer to the three epochs described in the spectral analysis and used in the spectra shown in Fig. 3. The vertical orange line shows the subdivision of the IXPE observation described in Sect. 3.2, and the dashed horizontal lines in the NICER and IXPE light curves indicate the mean values of the count rate.
Current usage metrics show cumulative count of Article Views (full-text article views including HTML views, PDF and ePub downloads, according to the available data) and Abstracts Views on Vision4Press platform.
Data correspond to usage on the plateform after 2015. The current usage metrics is available 48-96 hours after online publication and is updated daily on week days.
Initial download of the metrics may take a while.