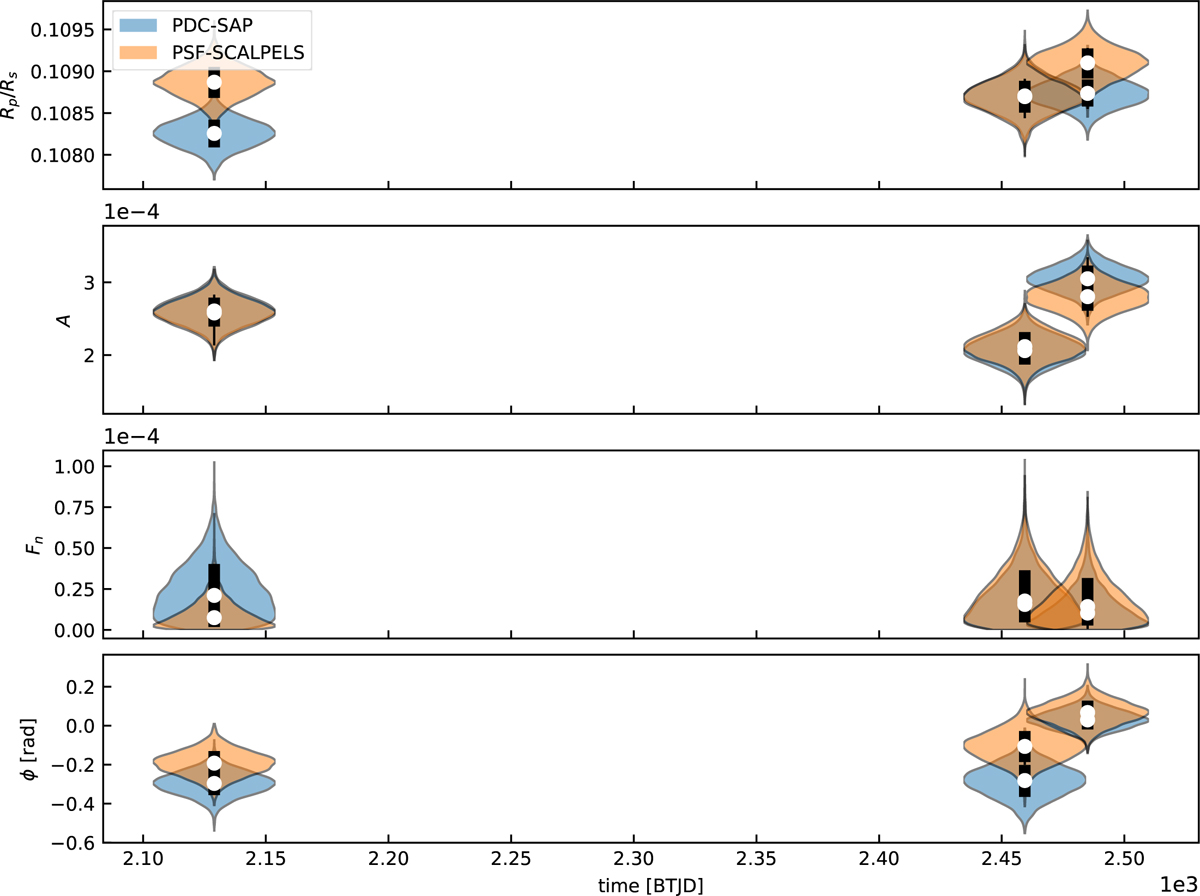
Fig. B.3
Download original image
Violin plot of the posterior probability density function of the parameters retrieved from the PDC-SAP and PSF-SCALPELS TESS light curves: The x-axis corresponds to the average time of each TESS sectors data from which the posteriors have been retrieved, sectors 30, 42 and 43 from left to right. The white circle in the middle of each violin plot corresponds to the median value of the distribution and the thick black line to the 68% confidence interval delimited by the 16th and 84th percentiles. We displayed only the key parameters for the planetary transit and its phase curve, from top to bottom: the radius ratio inferred from the transit, the amplitude of the phase curve, the night-side flux and the phase offset. The phase curve model used is the Cos model. More details on this model and its parameters are provided in Section 4.1.
Current usage metrics show cumulative count of Article Views (full-text article views including HTML views, PDF and ePub downloads, according to the available data) and Abstracts Views on Vision4Press platform.
Data correspond to usage on the plateform after 2015. The current usage metrics is available 48-96 hours after online publication and is updated daily on week days.
Initial download of the metrics may take a while.